
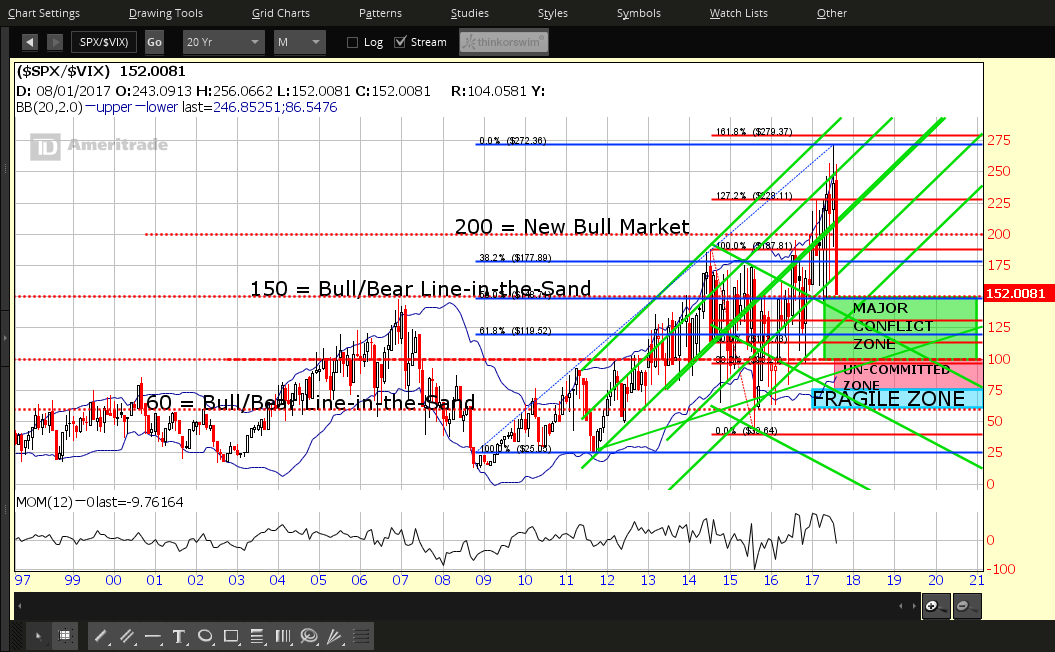
After today’s dramatic 36-point drop in the SPX, price on the SPX:VIX ratio plunged to the upper edge of a “Major Conflict Zone” and the “Bull/Bear Line-in-the-Sand” level, as shown on the Monthly ratio chart below.
A drop and hold below this critical 150 major support level will seal the fate of increased volatility and lower prices for the SPX. The Momentum indicator has also fallen below the zero level, confirming that instability is in store for this index, for the longer term, if it stays below zero.
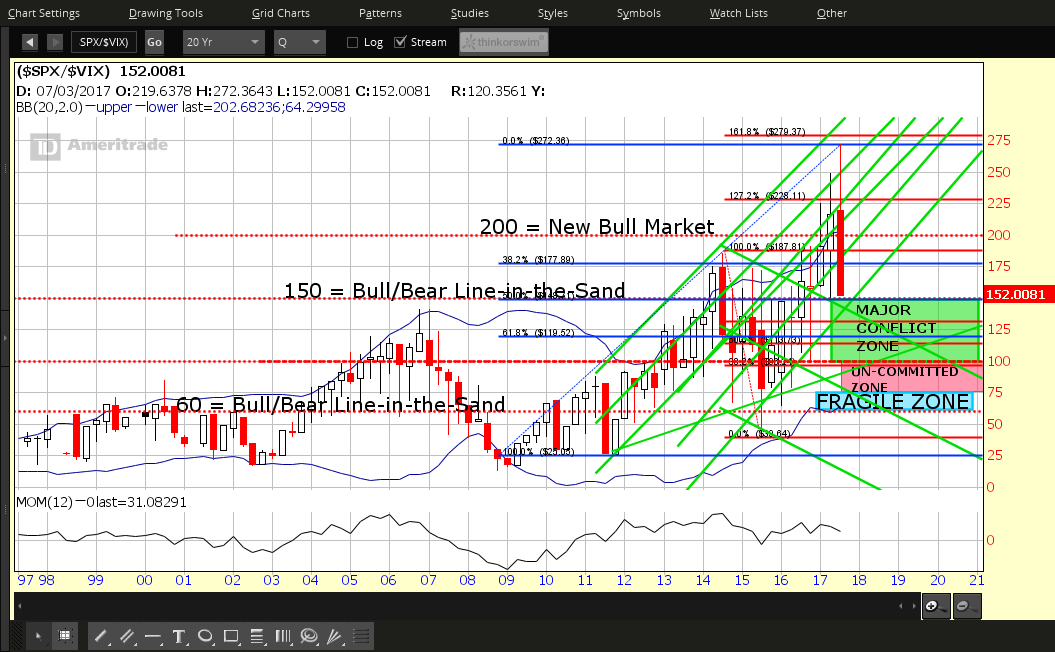
Each candle on the following ratio chart of SPX:VIX represents a period of One Quarter.
As of today’s close, the current candle (Q3 of 2017) is forming a massive bearish engulfing candle on, not only Q2, but also Q1. The lows of both of those candles are just above this 150 major support level, so a drop and hold below that would signal extreme weakness for the balance of this year. The downtrending Momentum indicator is also confirming such weakness.
We’ll see how this candle closes at the end of September, as it, along with the above monthly timeframe, could provide further insight into how well Q4 may perform.
In the meantime, I’d watch to see whether the Momentum indicator makes a lower swing low on the Weekly timeframe (see ratio chart below), as confirmation of further weakness ahead for the SPX in the medium term, should price breach the 150 level.

The Momentum indicator made an historical low on the Daily timeframe, as shown on the following ratio chart…signalling that volatility may, indeed, be ramping up in the short term…so, buckle up!

