
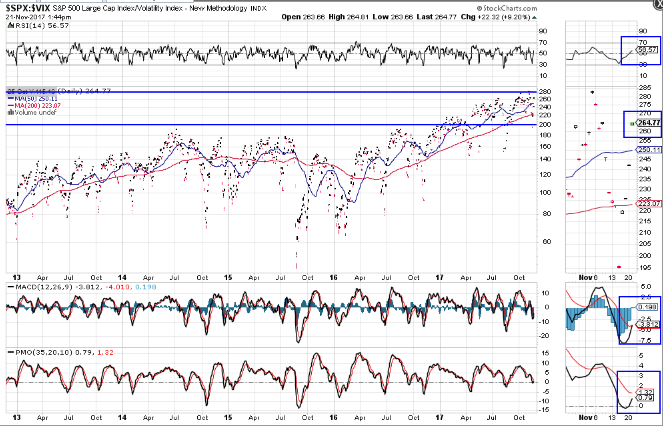
I last wrote about the SPX:VIX ratio in my post of October 25. I mentioned that if price dropped and held below the 200 level, expect volatility to increase and weakness to set in on the SPX…and, that if it failed to do so, we could see the SPX reach 2600 before such a scenario may ensue.
Since that date, we’ve seen the SPX stabilize somewhat, bounce around above 2560, and, finally, reach 2600 today (Tuesday), as shown on the Daily chart below.

After a brief dip below 200, a new “BUY” signal is about to form on the SPX:VIX ratio, as shown on the Daily ratio chart below.
However, it will be important for price on this ratio to reach and hold above the 280 major resistance level, and for the SPX to hold above 2600, in support of a convincing argument that favours the sustained entry of the SPX into a new bull-market phase.
This bird’s eye view of the SPX (Monthly chart) shows that it has not faced a major challenge in almost two years.
Price is, however, mashed up against major resistance in the form of a +2 standard deviation of a regression channel. If price does manage to spike through this, the next hurdle is an external Fibonacci retracement level at 2678.
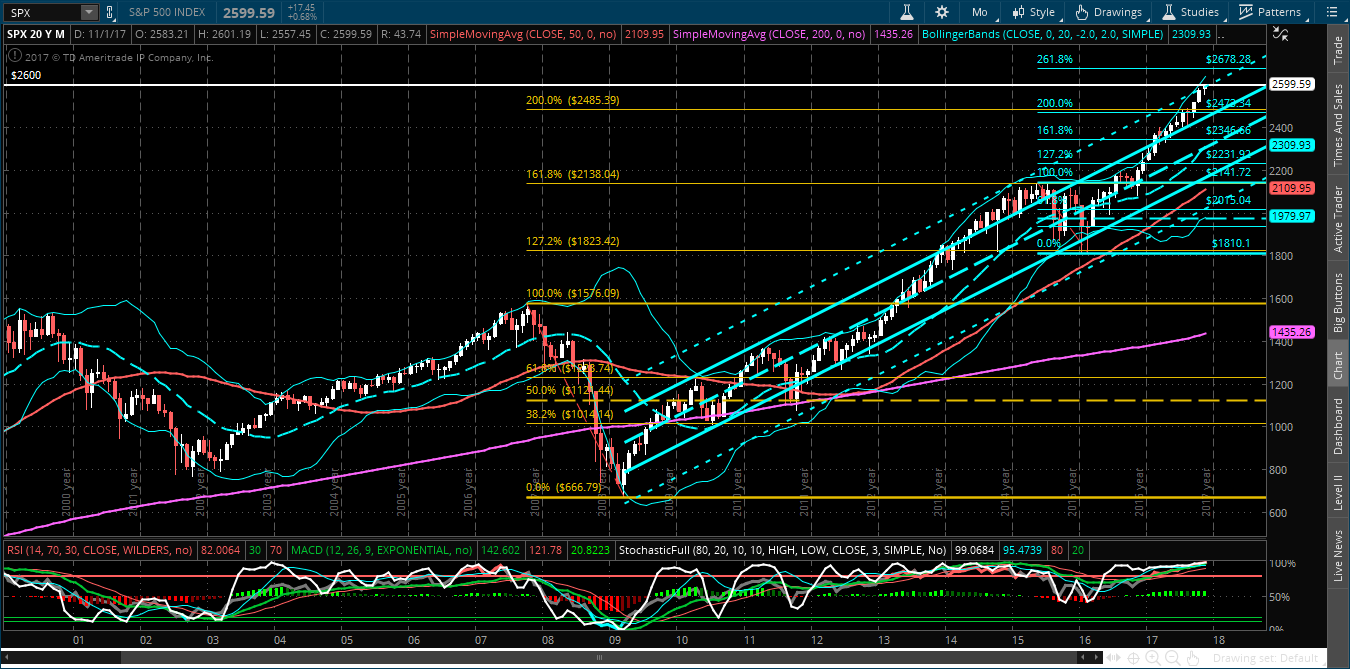
With the VIX down near historical lows (as shown on the Monthly chart below), the current battle unfolding within the Republican party to reform and cut taxes before the end of the year (with zero support from Democrats), and social chaos (sexual assault allegations) exploding across the U.S., we may see volatility increase, correspondingly, in equity markets in the weeks/months ahead…particularly in 2018, with the impending mid-term Congressional elections in November, with possible interest rate hikes by the Fed, and, especially, if tax reform/cuts fail.

