
Perhaps it seems like I’m making this up as I go along, adding feature after feature all willy-nilly. Believe it or not, I actually have a plan in mind, and we’re getting there one baby step at a time. Here’s another step, and I assure you, this is the start of something much larger.
SlopeCharts now has a one-of-a-kind way to represent the options contracts that exist for a given financial instrument, and we call them OptionDots. To use them, just click on the Delta symbol (that is, the triangle) on the row of SlopeLinks:
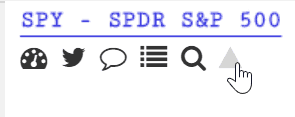
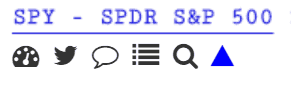
When you do, the color of the triangle will change from black to blue, indicating you are in OptionDots mode. Henceforth, any symbol you look at will show its options (if any) on the chart itself.
Here, for example, is a portion of the SPY chart. Each dot represents a specific strike and expiration. Naturally, there will tend to be far more dots closer to the present time and present price. The farther in-the-money or out-of-the-money you get, or the farther out in time you get, the more sparse the dots become.
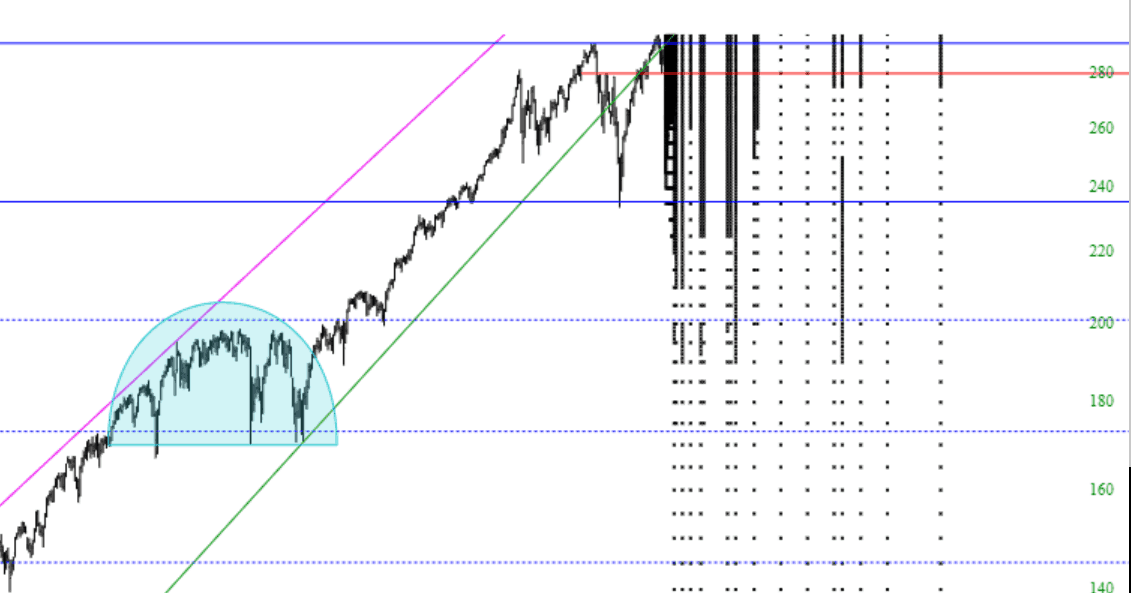
As with SlopeCharts in general, you can zoom in to any particular portion of the chart for more detail.
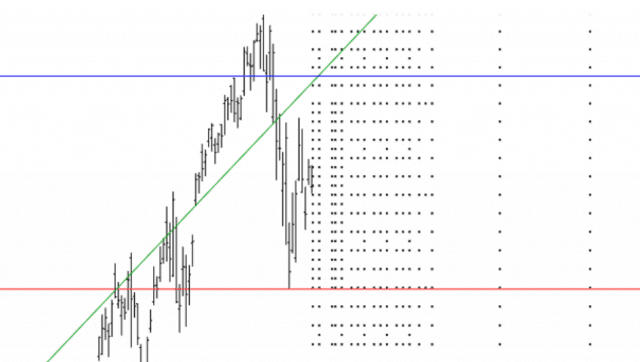
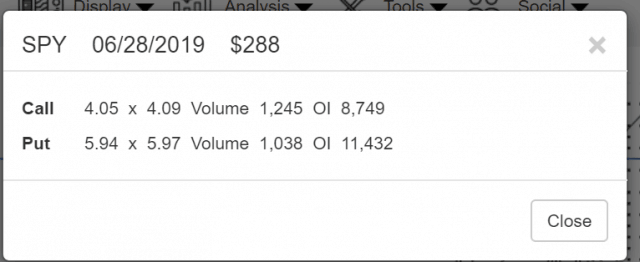
Clicking on any specific dot will bring up the quote for the Call and Put, and the information about the expiration and strike will be shown in the title bar.
I am eager to hear your suggestions, although in some instances I’ll simply tell you it’s already on the drawing board. Still, please Contact Me if you have any ideas on this you’d like to share.
