
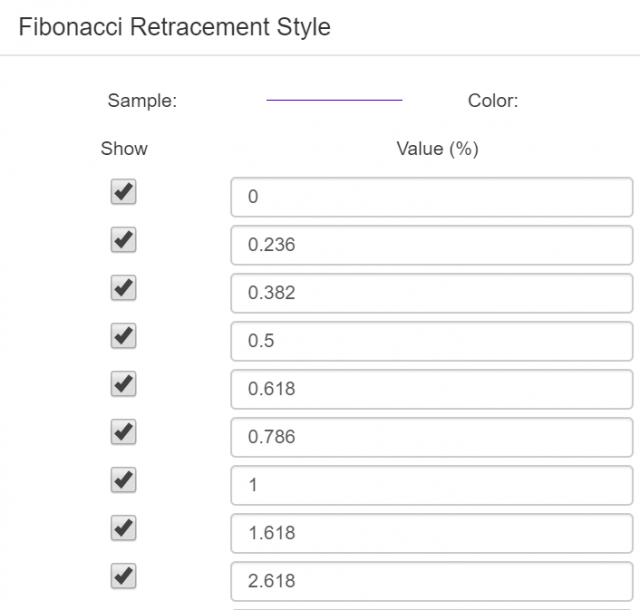
I’m not sure what you did on Friday night, but it was probably different than how I spent mine: looking at charts and, in particular, Fibonacci extensions. In other words, this dialog box in SlopeCharts:
What I found was mildly interesting. I did a retracement to two anchor points on the S&P 500, which I have circled in red below (click graph for big version). There were two extensions automatically drawn above the highest anchor.
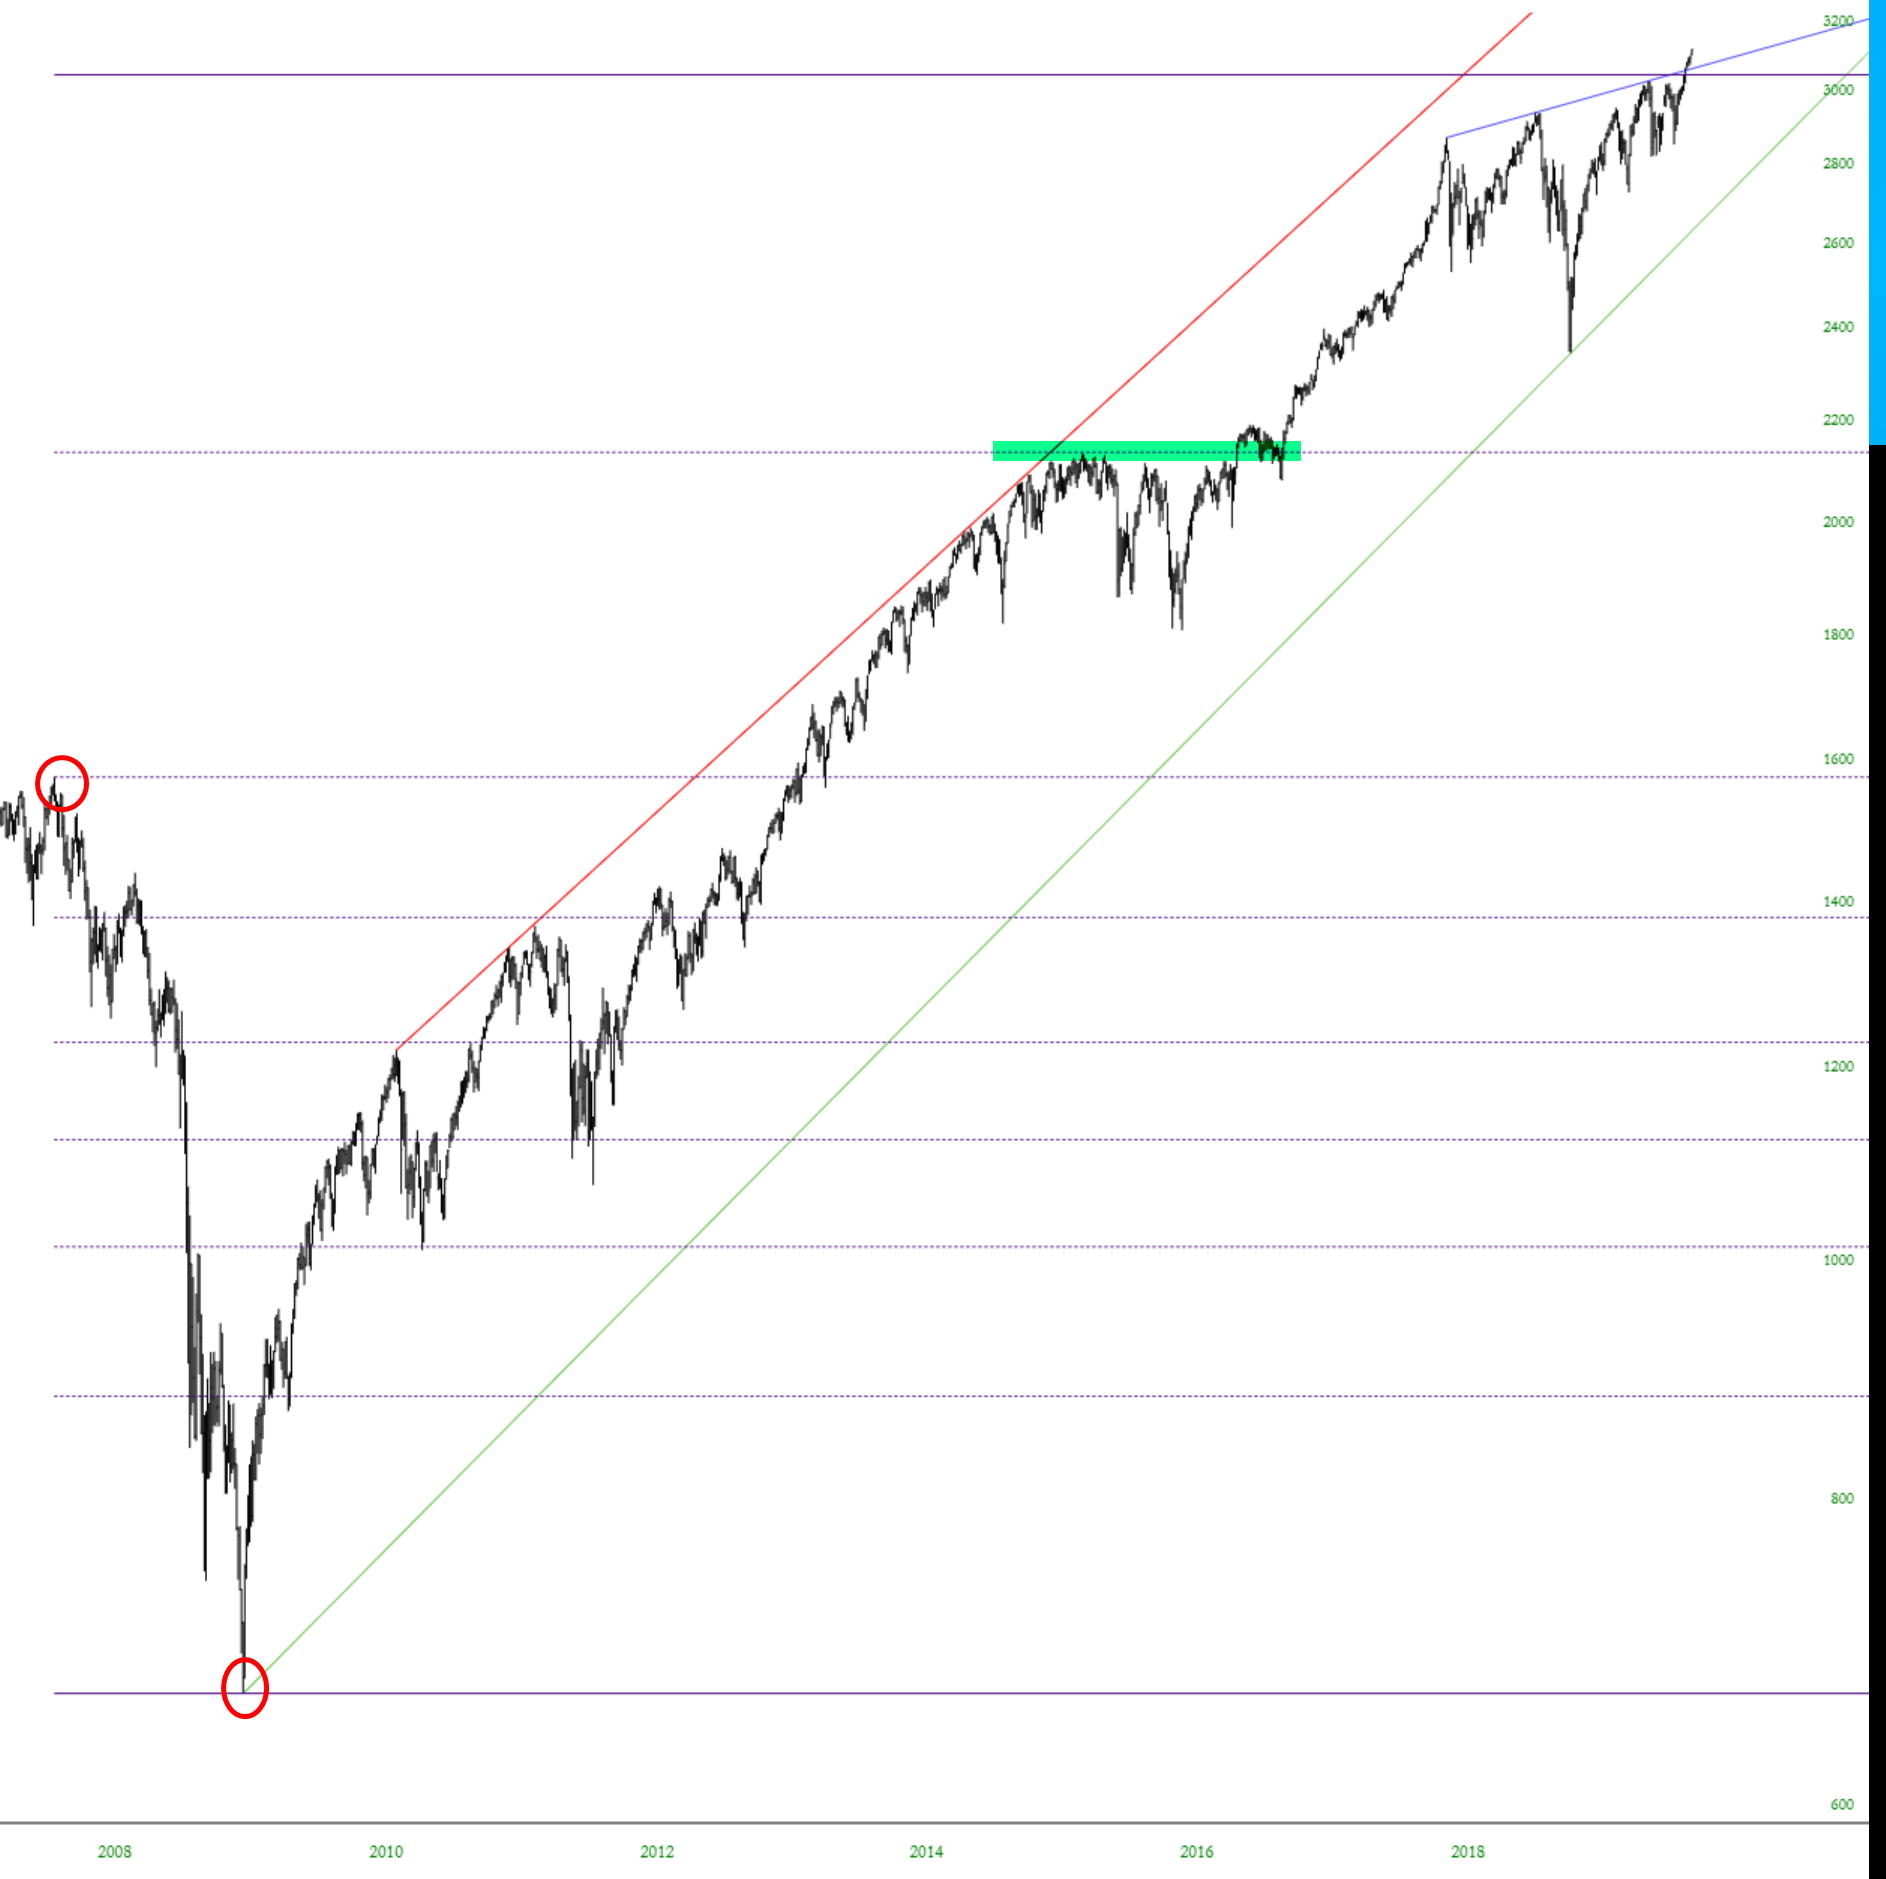
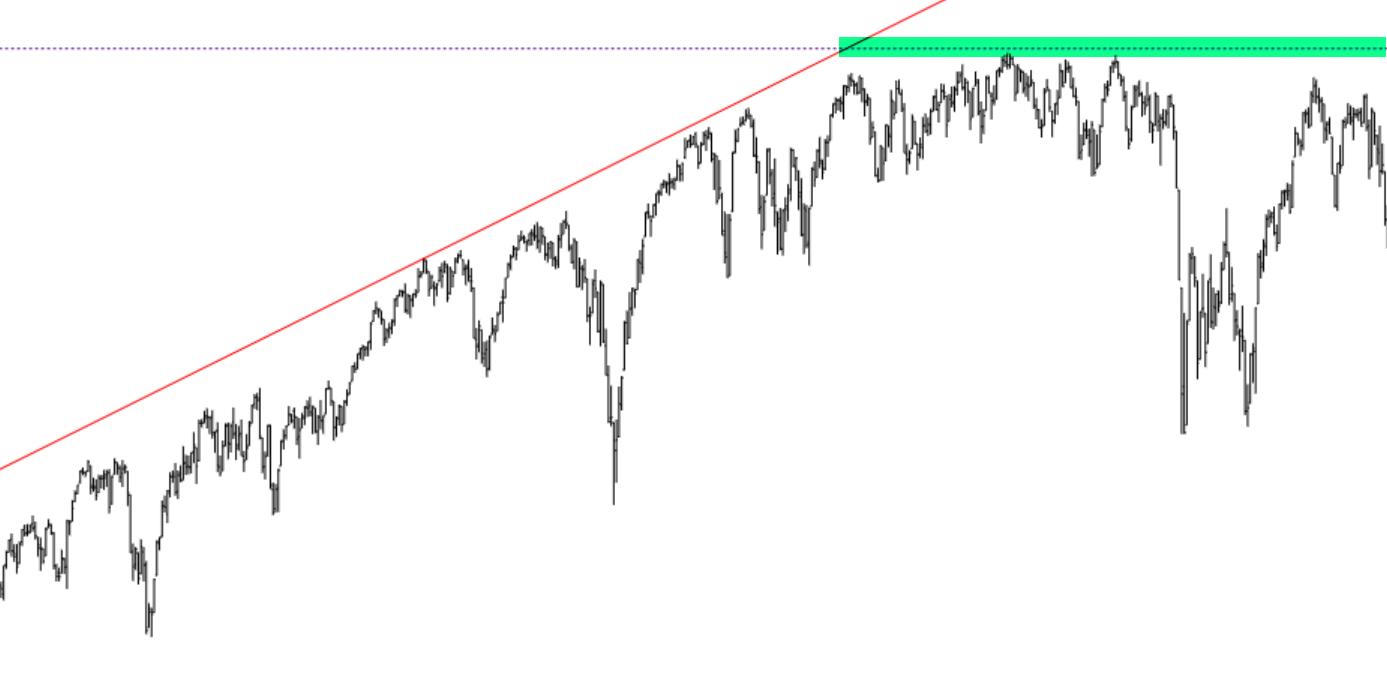
The first extension did an amazing job providing a “ceiling” to price thrust. In other words, the S&P 500 went up for years without any hesitation, but the moment it got to the 1.618 level, blammo, it stopped cold. It’s actually kind of jaw-dropping. In fact, it came within 99.85% of the target. We’re talking about 3 S&P points on an index valued at 2134.
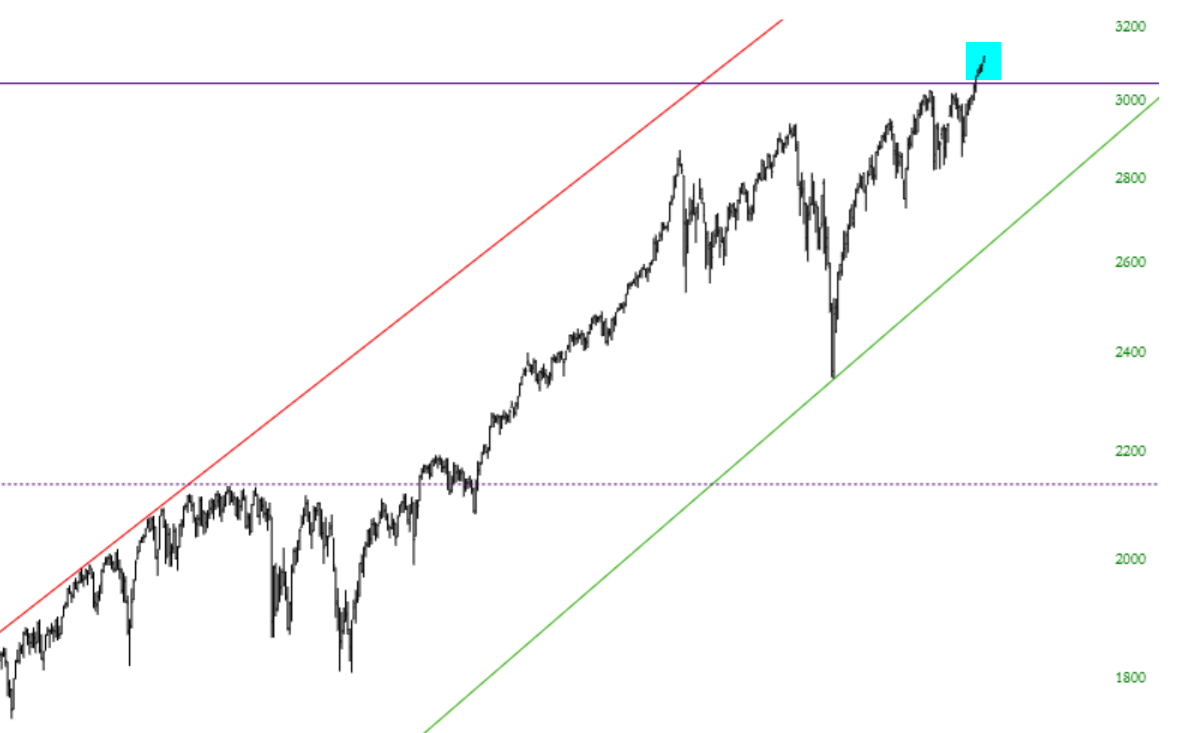
After months of grinding away, thanks to the darling Federal Reserve’s help, it reached escape velocity and was able to rocket higher once more. Now I would love to say it stopped cold at the 2.618 level, but, just to piss me off, it didn’t do so. We have overshot the level. Whether this is a temporary overshoot or whether the extension is irrelevant at this point remains to be seen.
Out of curiosity, I did something similar with the Dow Jones Composite. Again, the anchor points are circled in red.

In this case, the results are a little more intriguing. Prices got slammed to a halt at 1.618 (green tint) and, more recently, they have slipped just 1% above the 2.618 level. A violation, yes, but what’s 1% between friends?
In the coming weeks, it will be interesting to see if these highest extension levels have any sway or not.
