
OK. Deep breath.
Let’s start with something simple and discord-free. My positions:
- 5 puts (AMD, BYND, CAKE, MU, KLAC)
- 30 shorts
- No big positions at all, and not a single ETF position
- Doing a lot of scalping during the day, which is unusual for me
- About 80% committed. Relatively light, but still participating.
So, look. Confession time. I acted like a real jerk today (I originally used a stronger word), and I feel terrible about it. Three weeks of this mayhem, and some of my gears have started to come loose. That, plus, I’m such a Boy Scout, one too many cups of coffee sends me into something usually associated with angel dust. So I went to a bad place, and I am seriously sorry for my behavior. I need to get a hold of myself. Jeez, Tim. Get a grip.
Having said that, with head hanging low, let me take another deep breath and offer up some charts with some commentary.
I have six index charts below. I have grouped them into three pairs.
The first pair I would describe as the “heading to December 26th” group. Markets are in a free-fall. It will take a shockingly exciting initiative from D.C. to slam the brakes on this, and who knows, it may happen. But, failing that, the natural path seems to be to revisit Q4 2018. There’s simply nothing left holding things up. So we have the Dow Jones Composite and the Dow Jones Industrial Average.


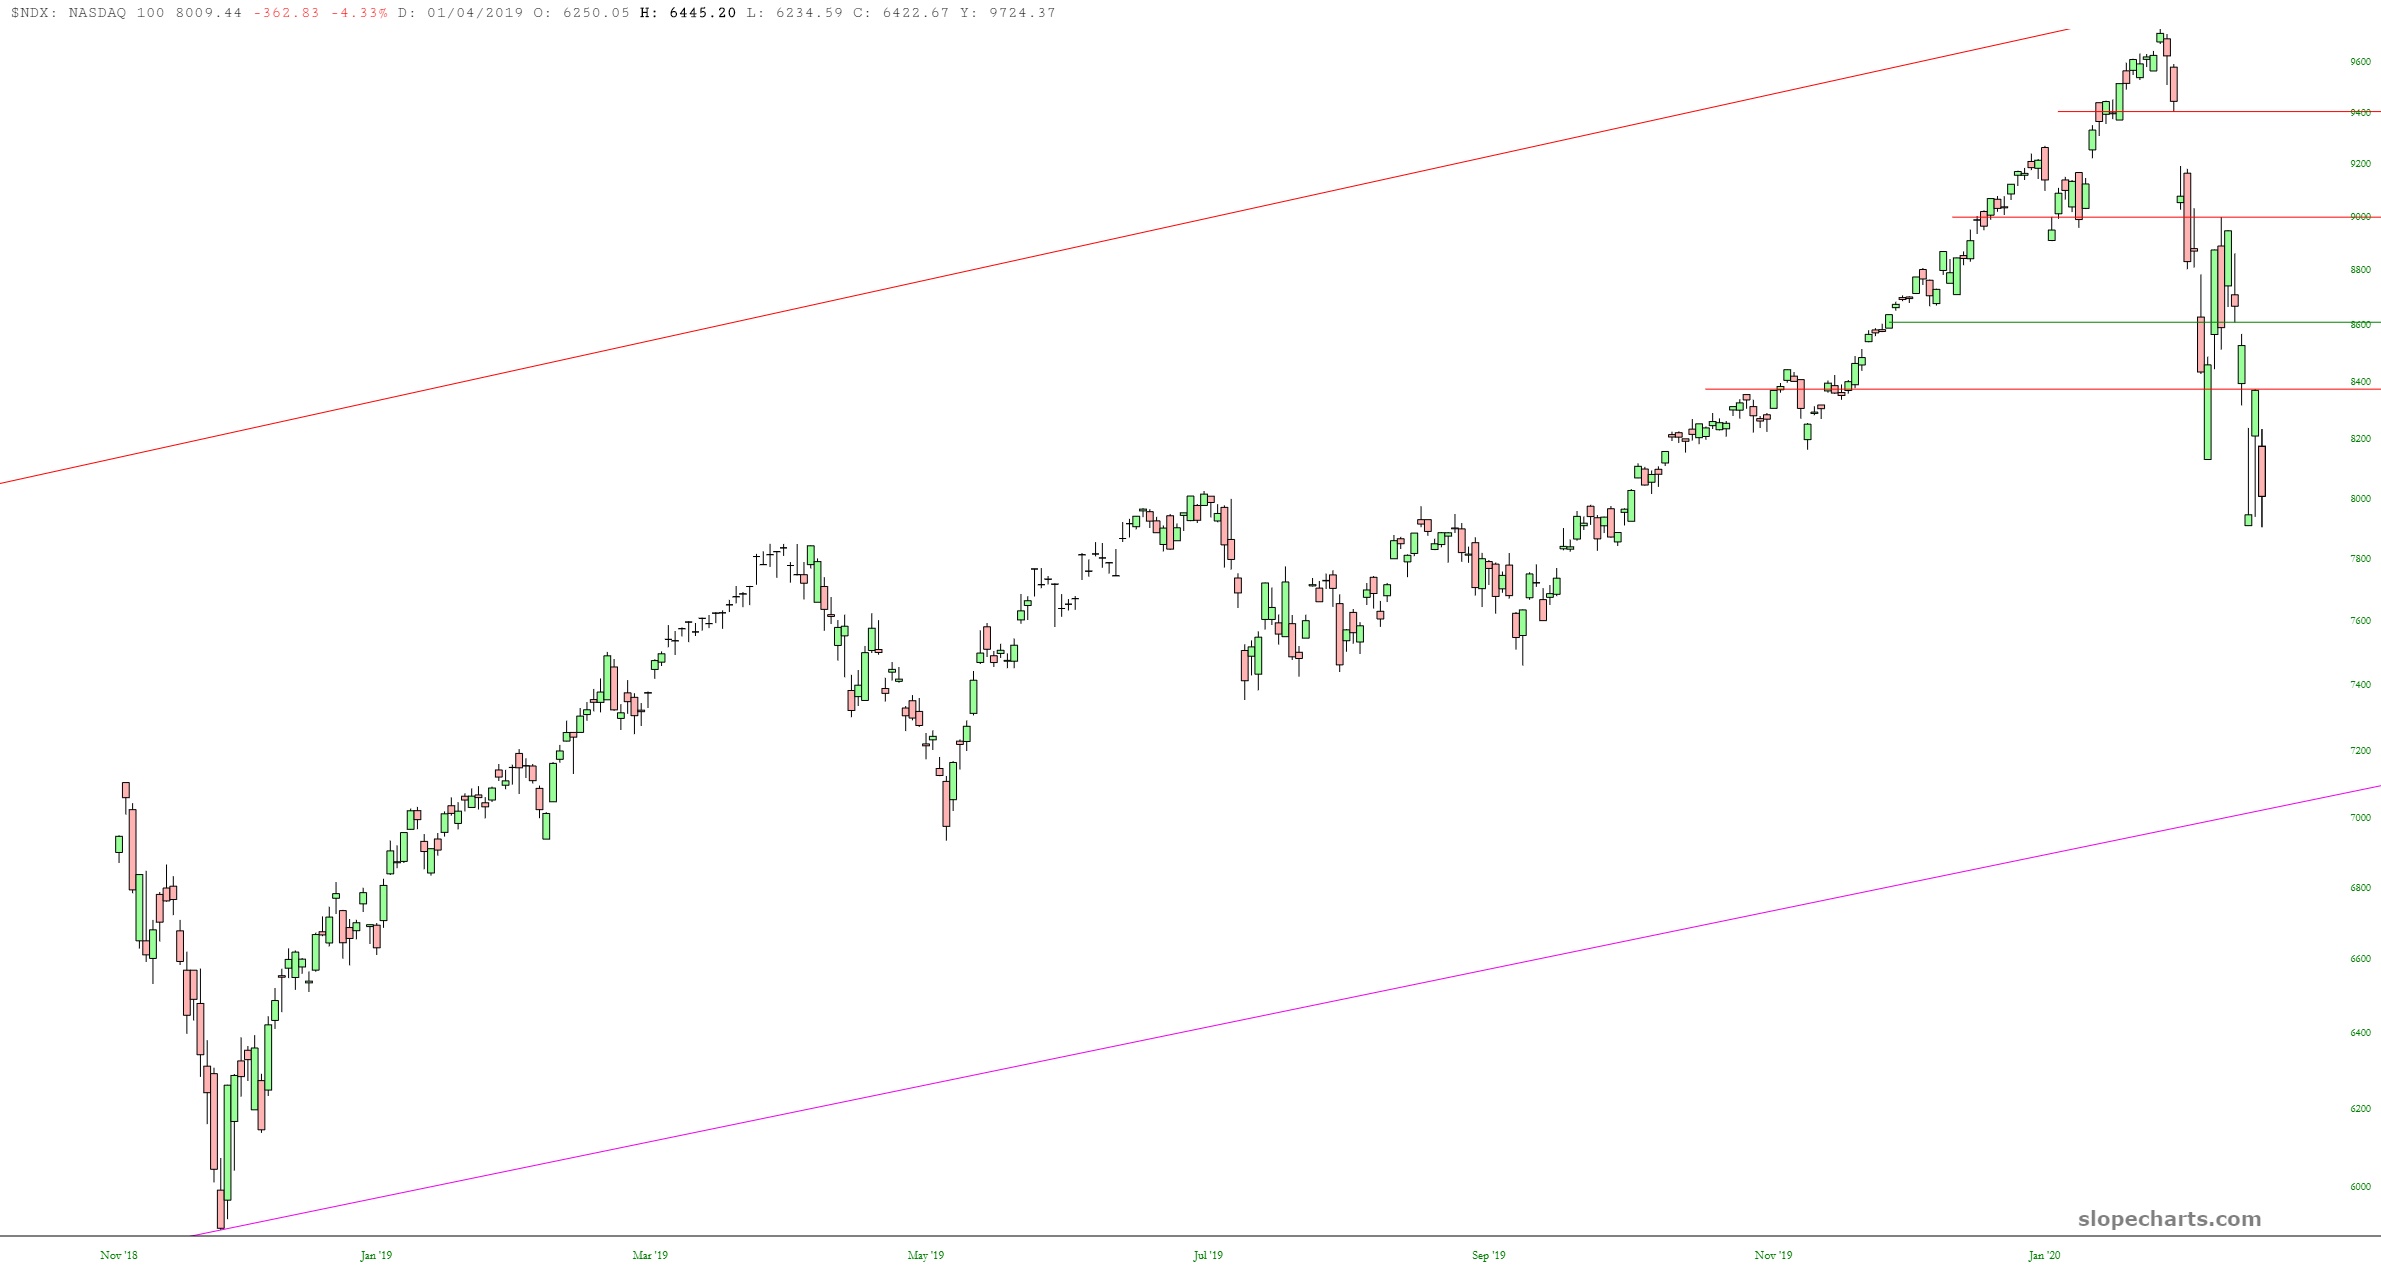
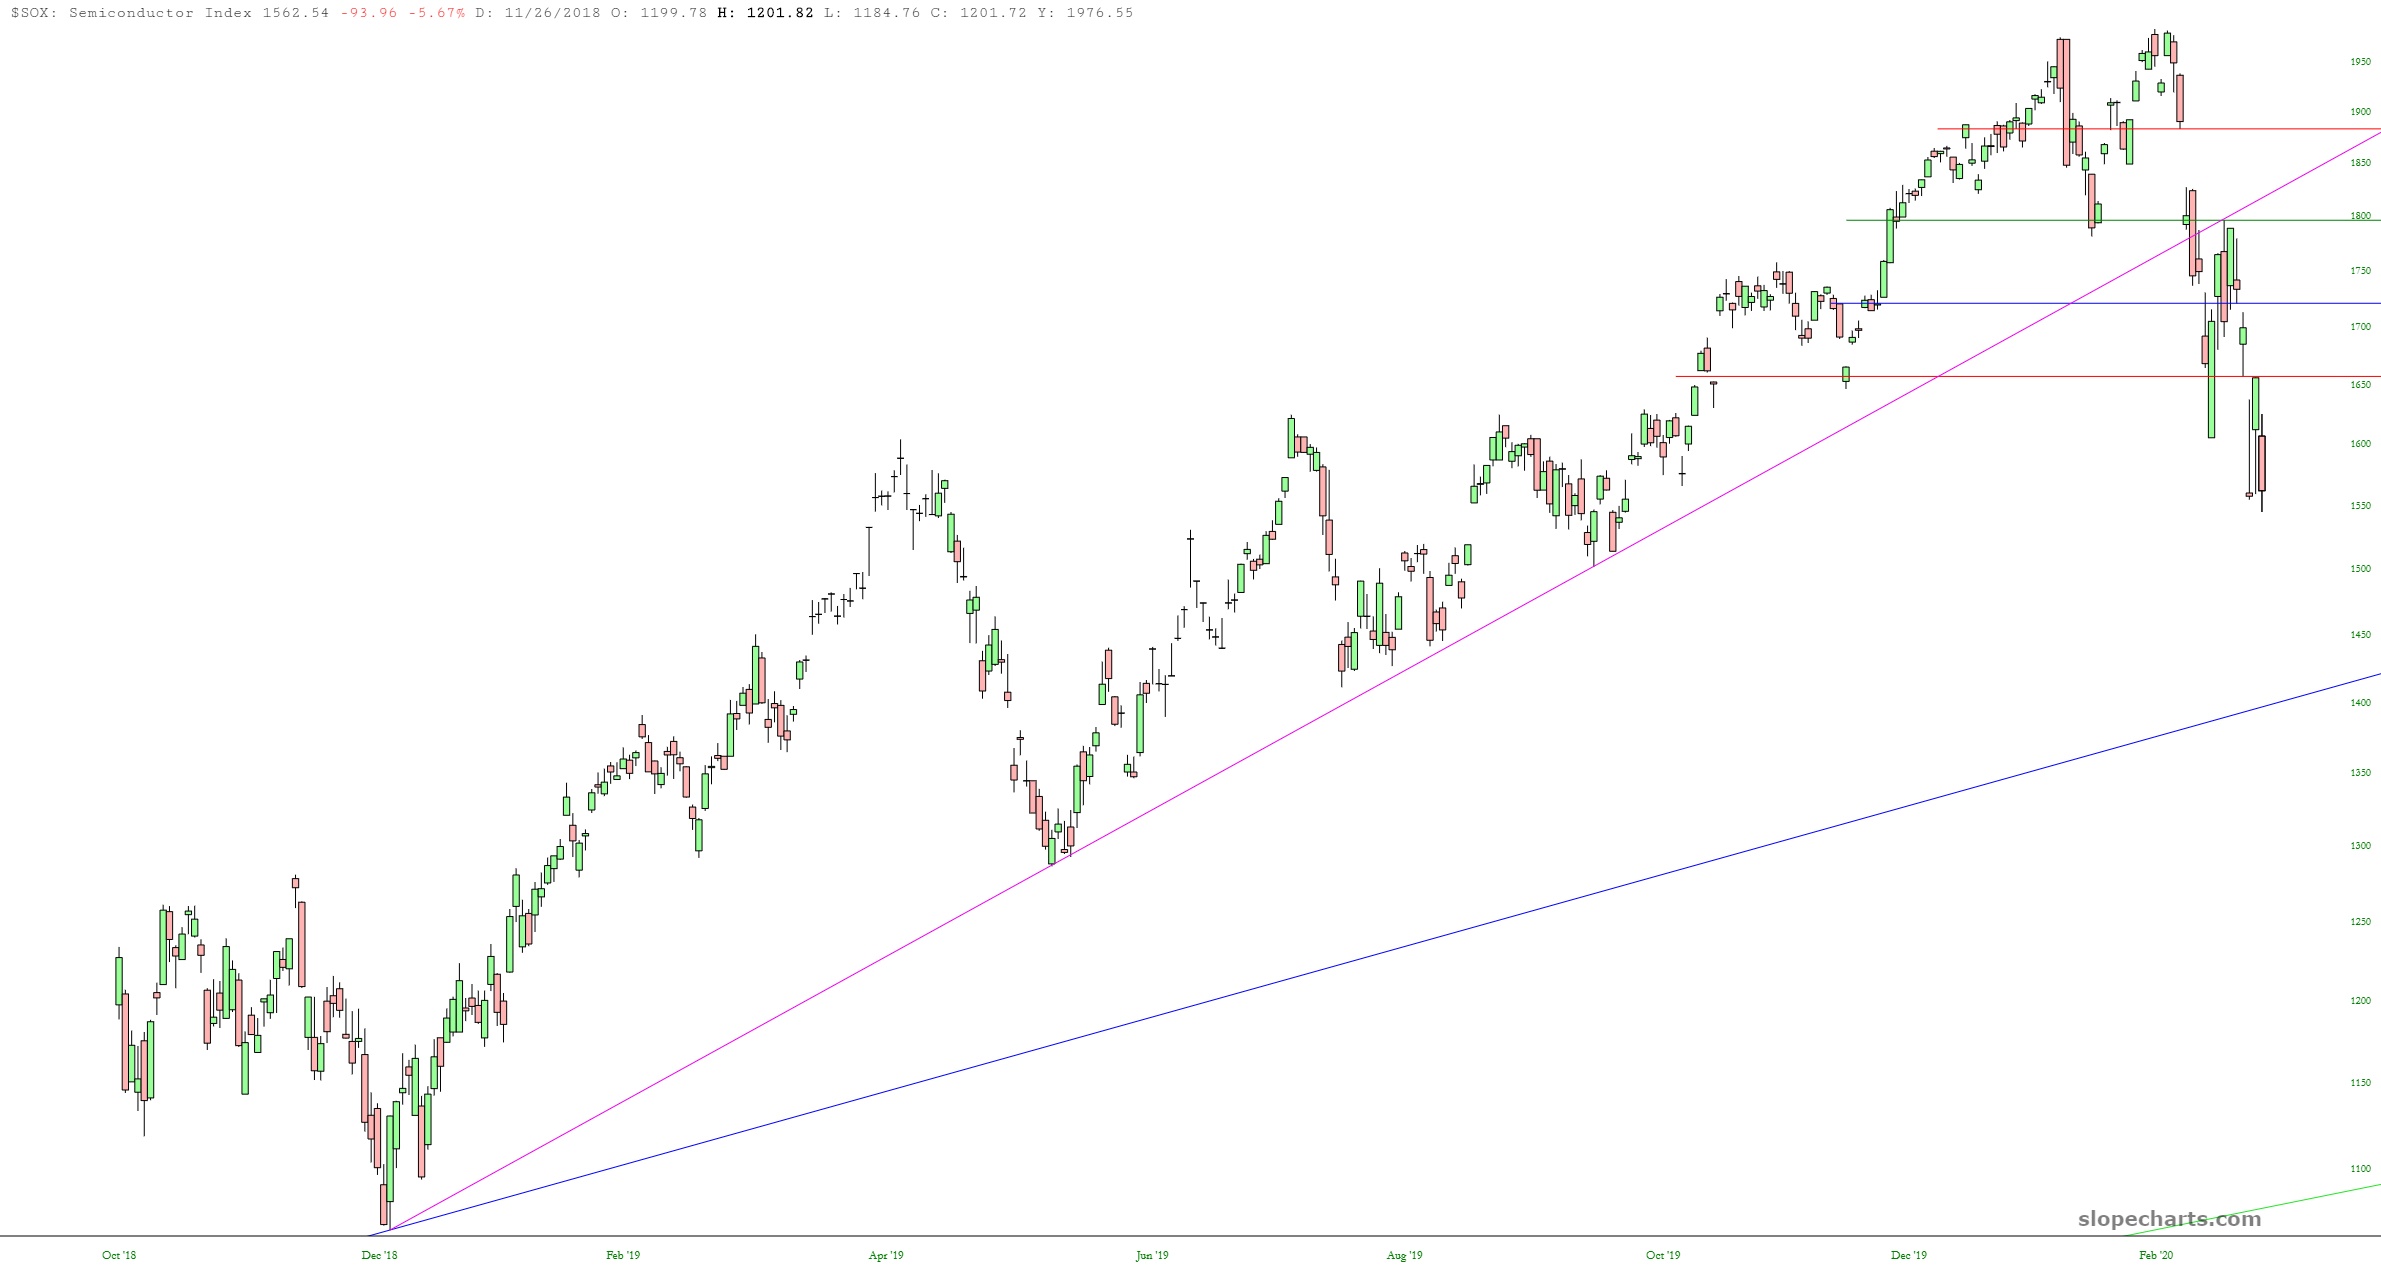
Next up we have the “heading for the supporting trendline” group, which is the NASDAQ Composite and the Semiconductor Index.
The reversal pattern is well-formed, and gravity has quite clearly taken hold. As I said above, only a well-received, global, coordinated effort – – and I must emphasize well-received!! – – would bring temporary strength. Whether that happens or not, I still think a tag of the trendline is forthcoming.
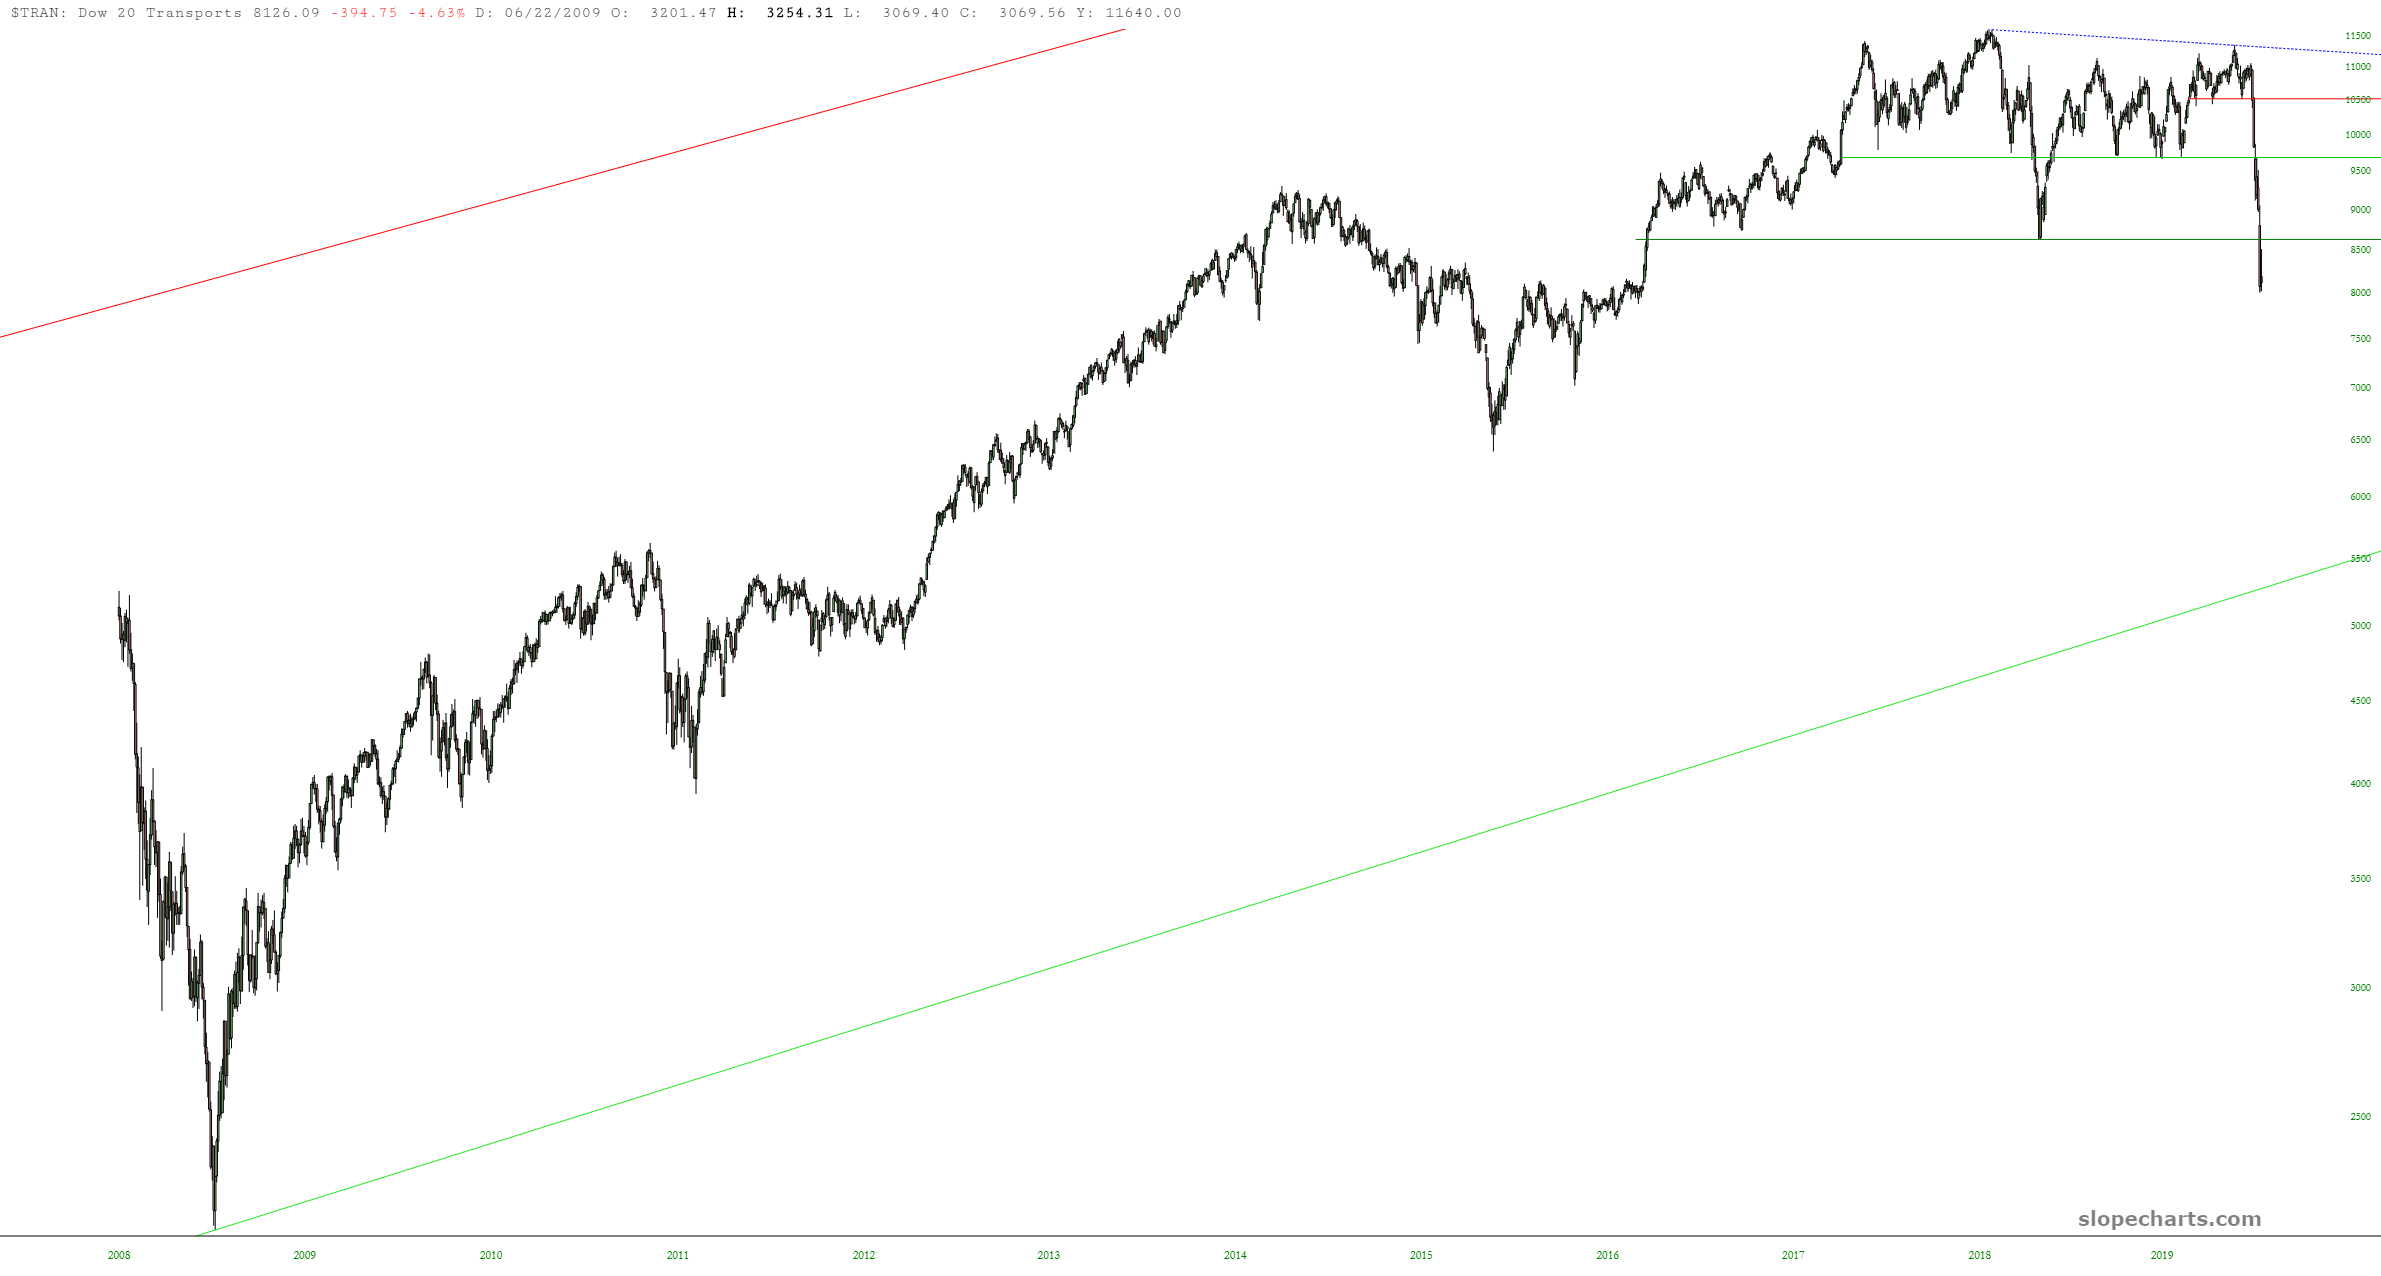
The last pair I’d describe as the “free-falling from a bridge” pair. Below are the Russell 2000 and the Dow Jones Transportation Index.
These charts are cataclysmic. Apocalyptic. I’m out of multi-syllabic superlatives, but you get the idea. Biblical stuff.

When I started typing this, the ES was up nearly 30. At this moment, it’s only three points.
We are truly living through history. None of us have ever seen anything like it.

