
What was going to happen on Monday? Would the hedge funds all dump their longs to cover their losses? Surely the market would crash, right? Uh-huh. The only red seen was for a couple of hours after the open on Sunday, and then it was green, green, green. But let’s look at seven important index charts to get some broader contest.
The Dow Jones Composite has quite plainly broken its uptrend. Monday’s rally is immaterial. There’s been a change.

At a more granular level, you can see this reflected in its most famous component, the Dow 30 Industrials. All today accomplished was to undo some of Friday’s damage.
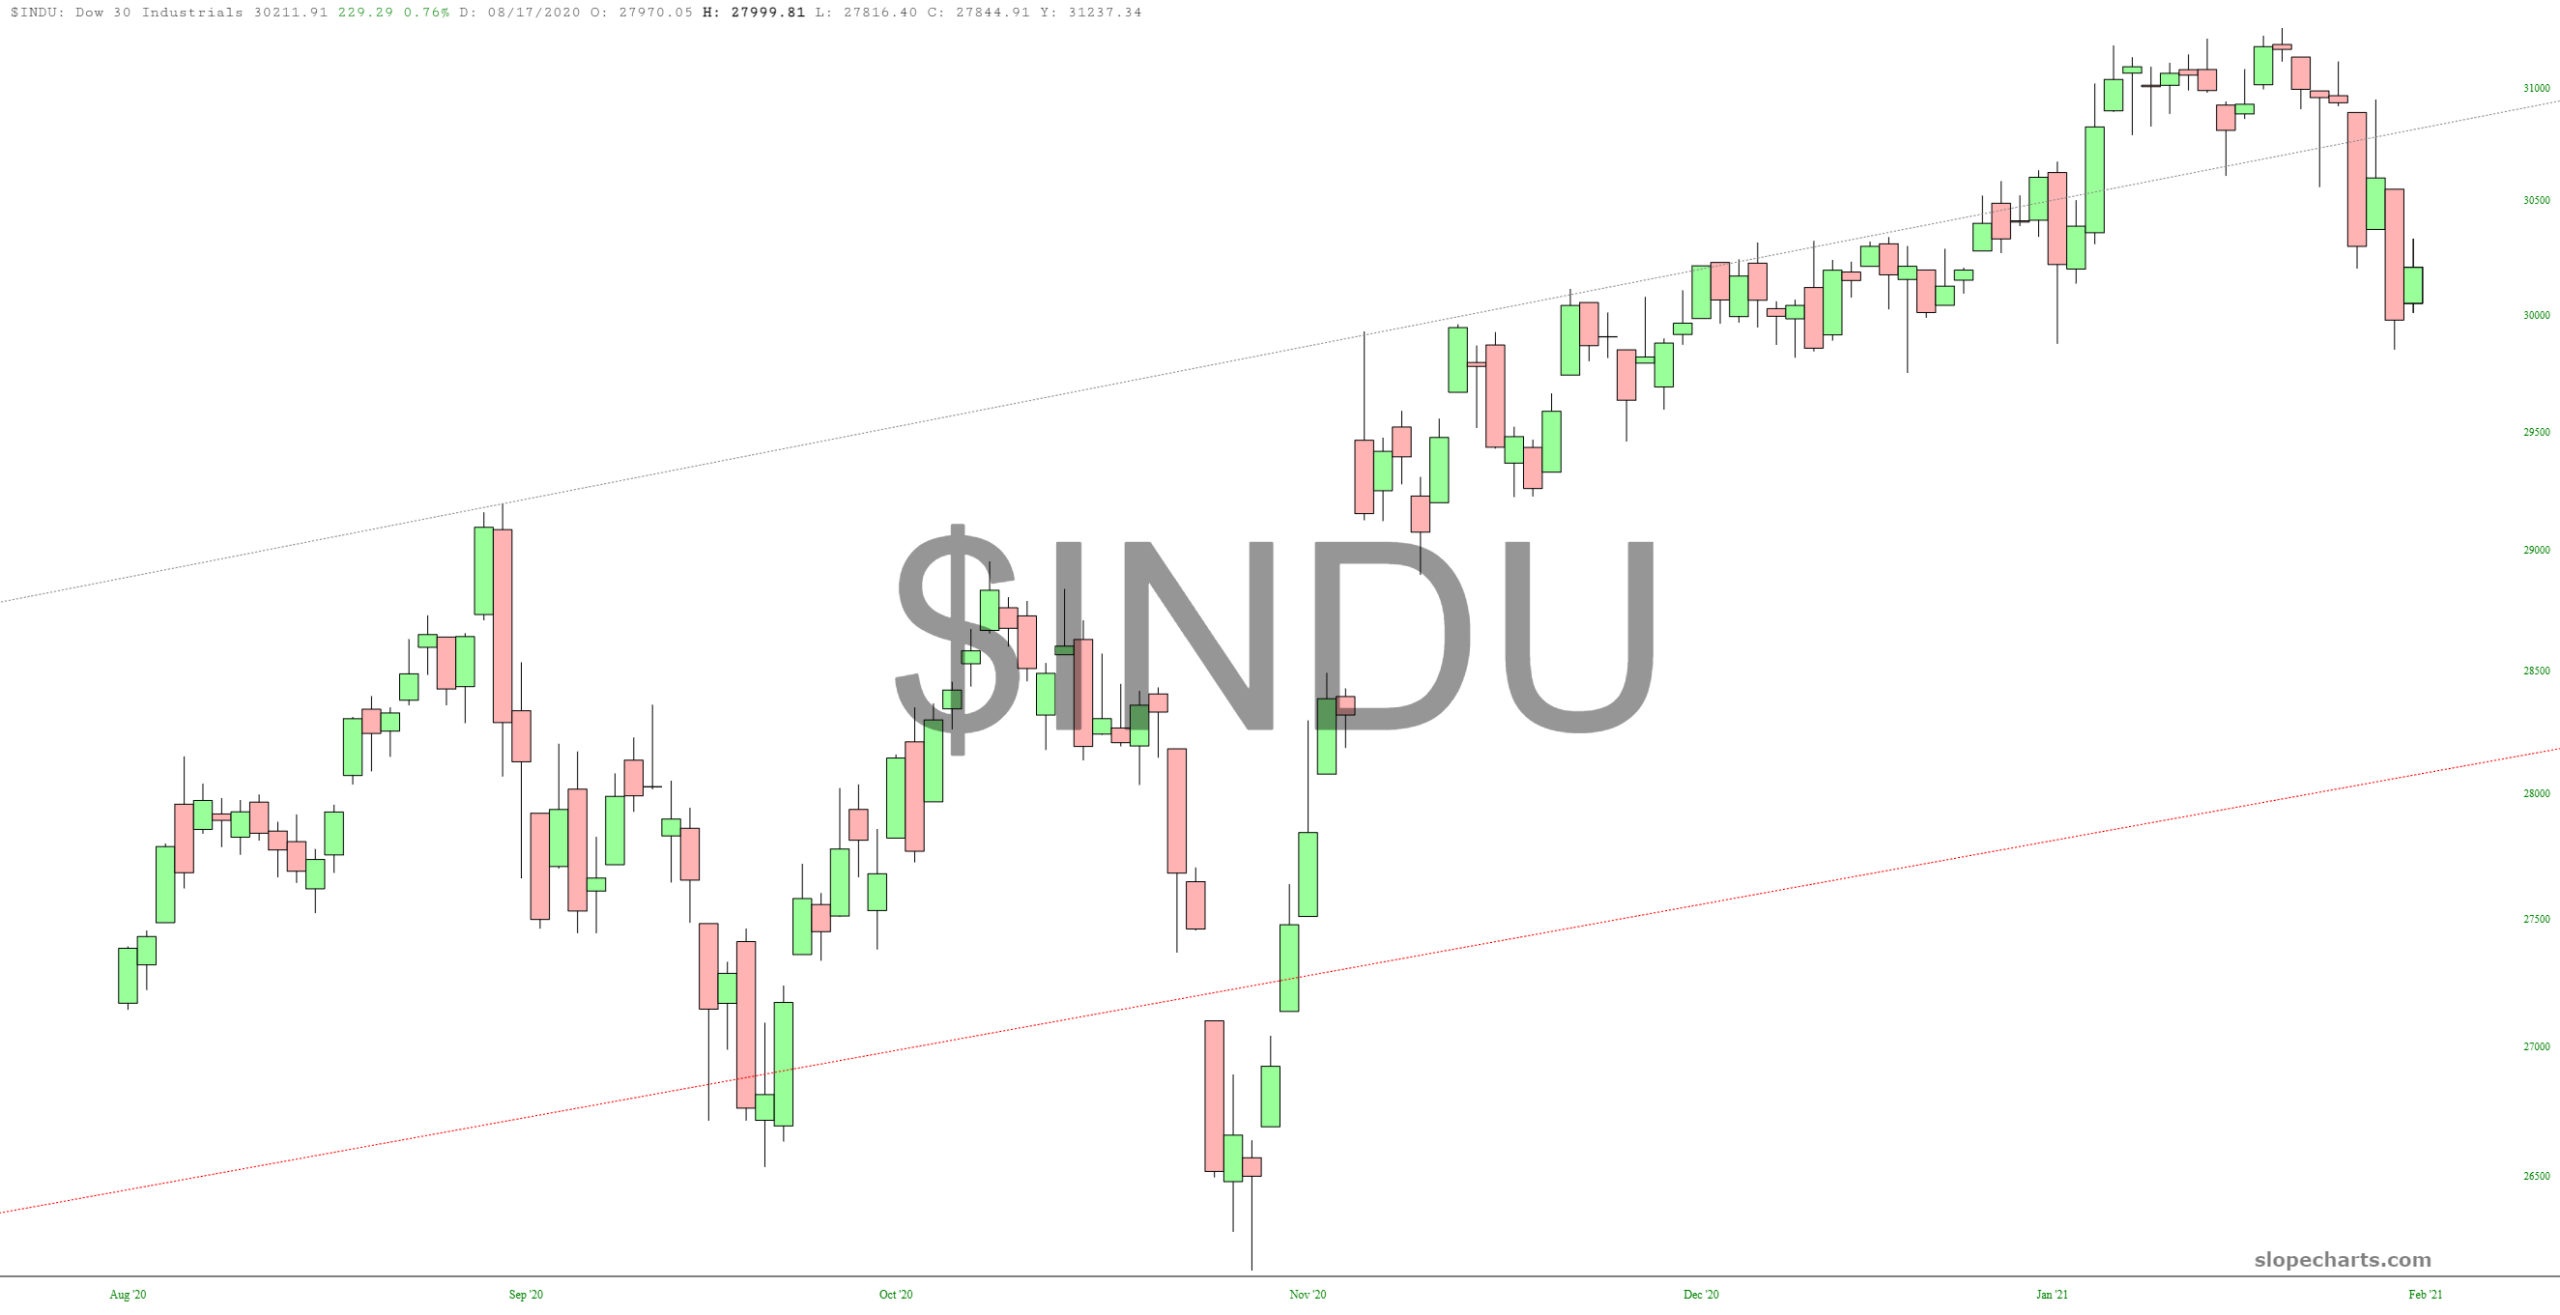
I incorrectly thought that all the fun earnings were behind us, but I was dead wrong. I glanced at this week’s calendar, and both Amazon and Google report Tuesday after the close, which should make for some excitement. If there’s one thing that could really push prices below the already-damaged trendline, it would be even a medium-hard down day on either AMZN or GOOGL.
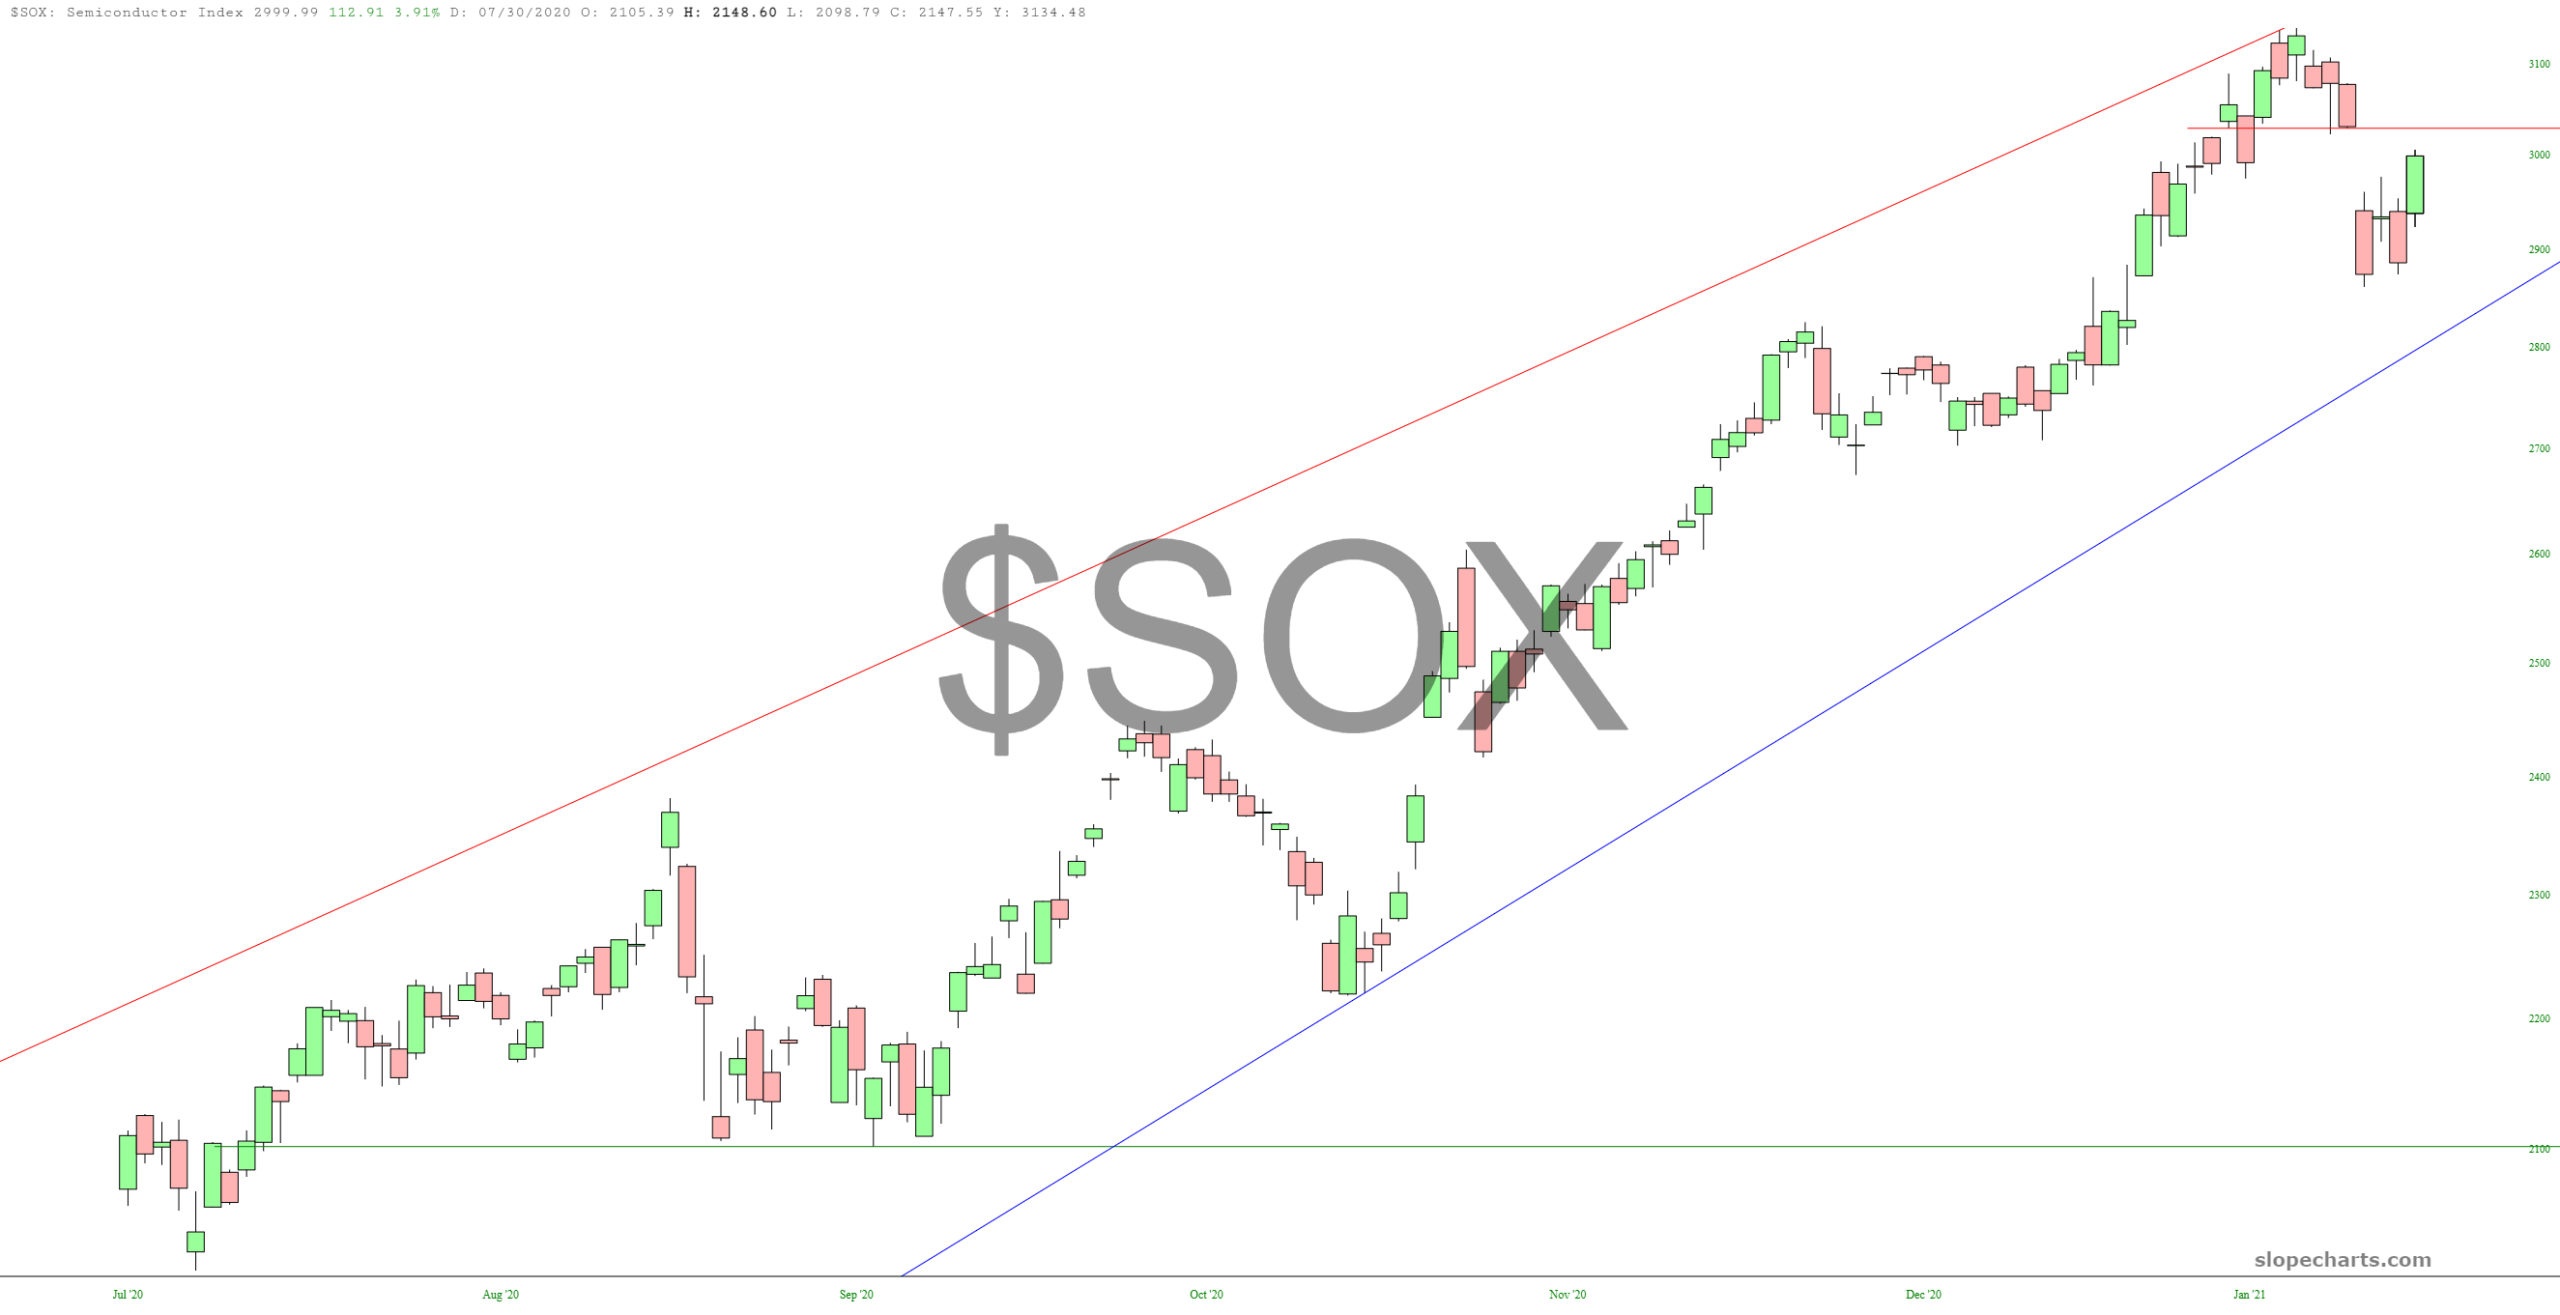
The semiconductor index has an important price gap which, if it holds, could ultimately set us up for a trendline failure.
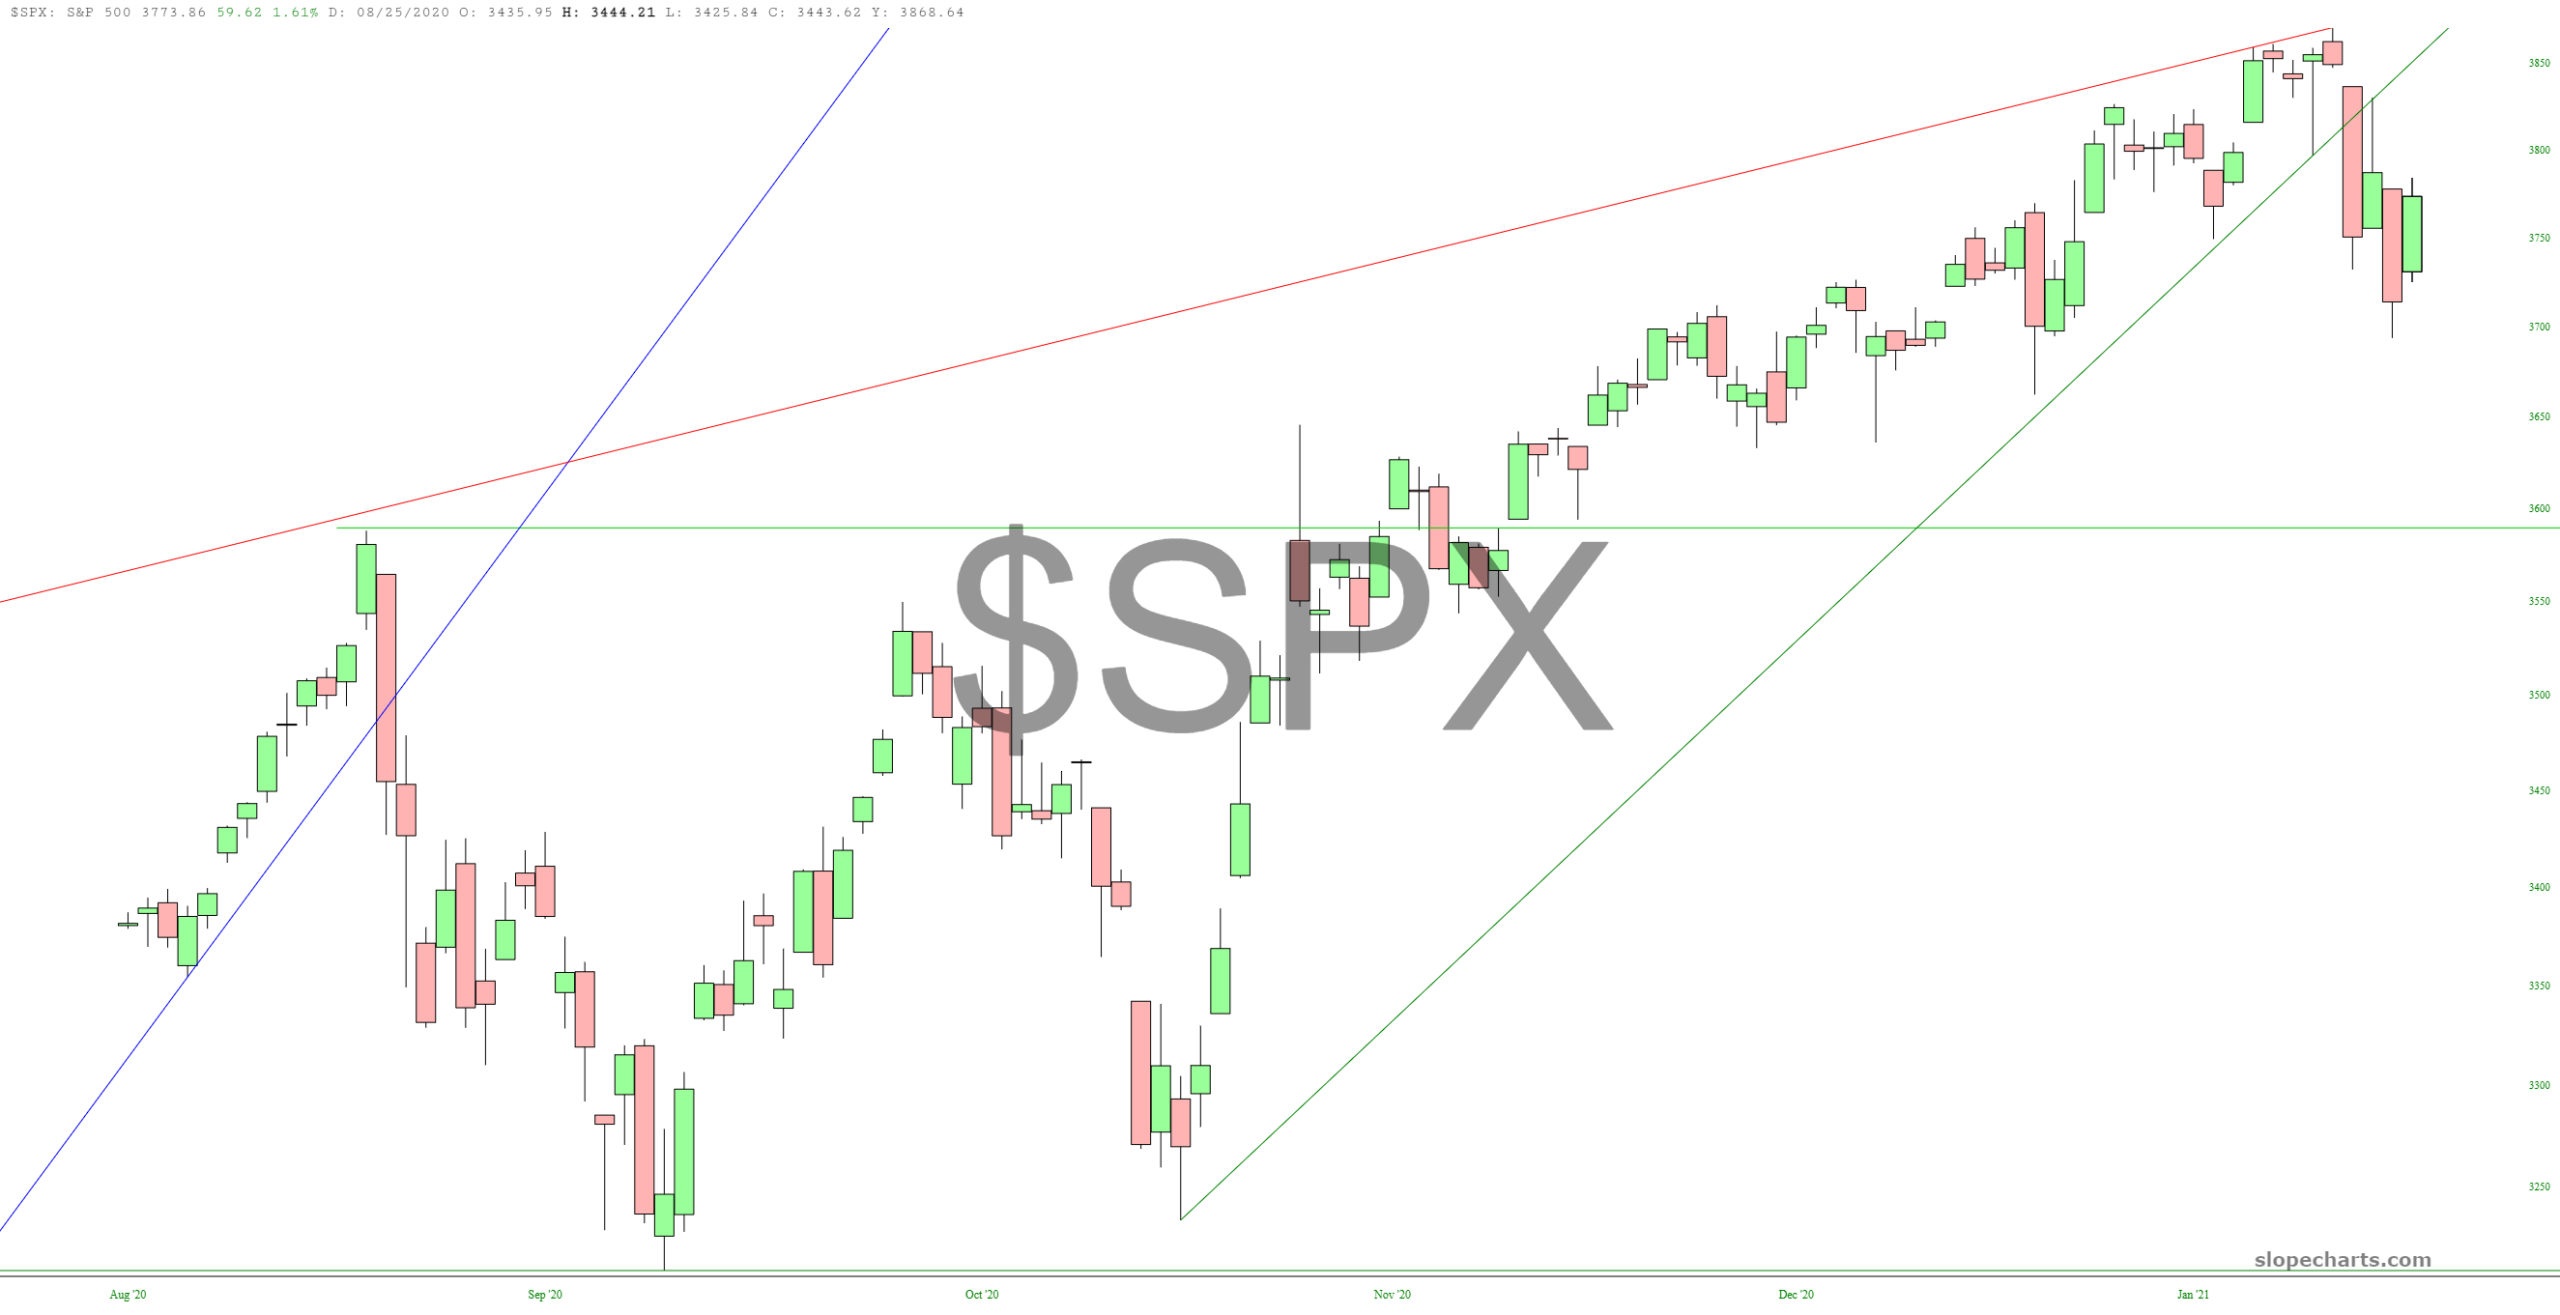
The terminal diagonal wedge on the S&P 500 is still picture-perfect.
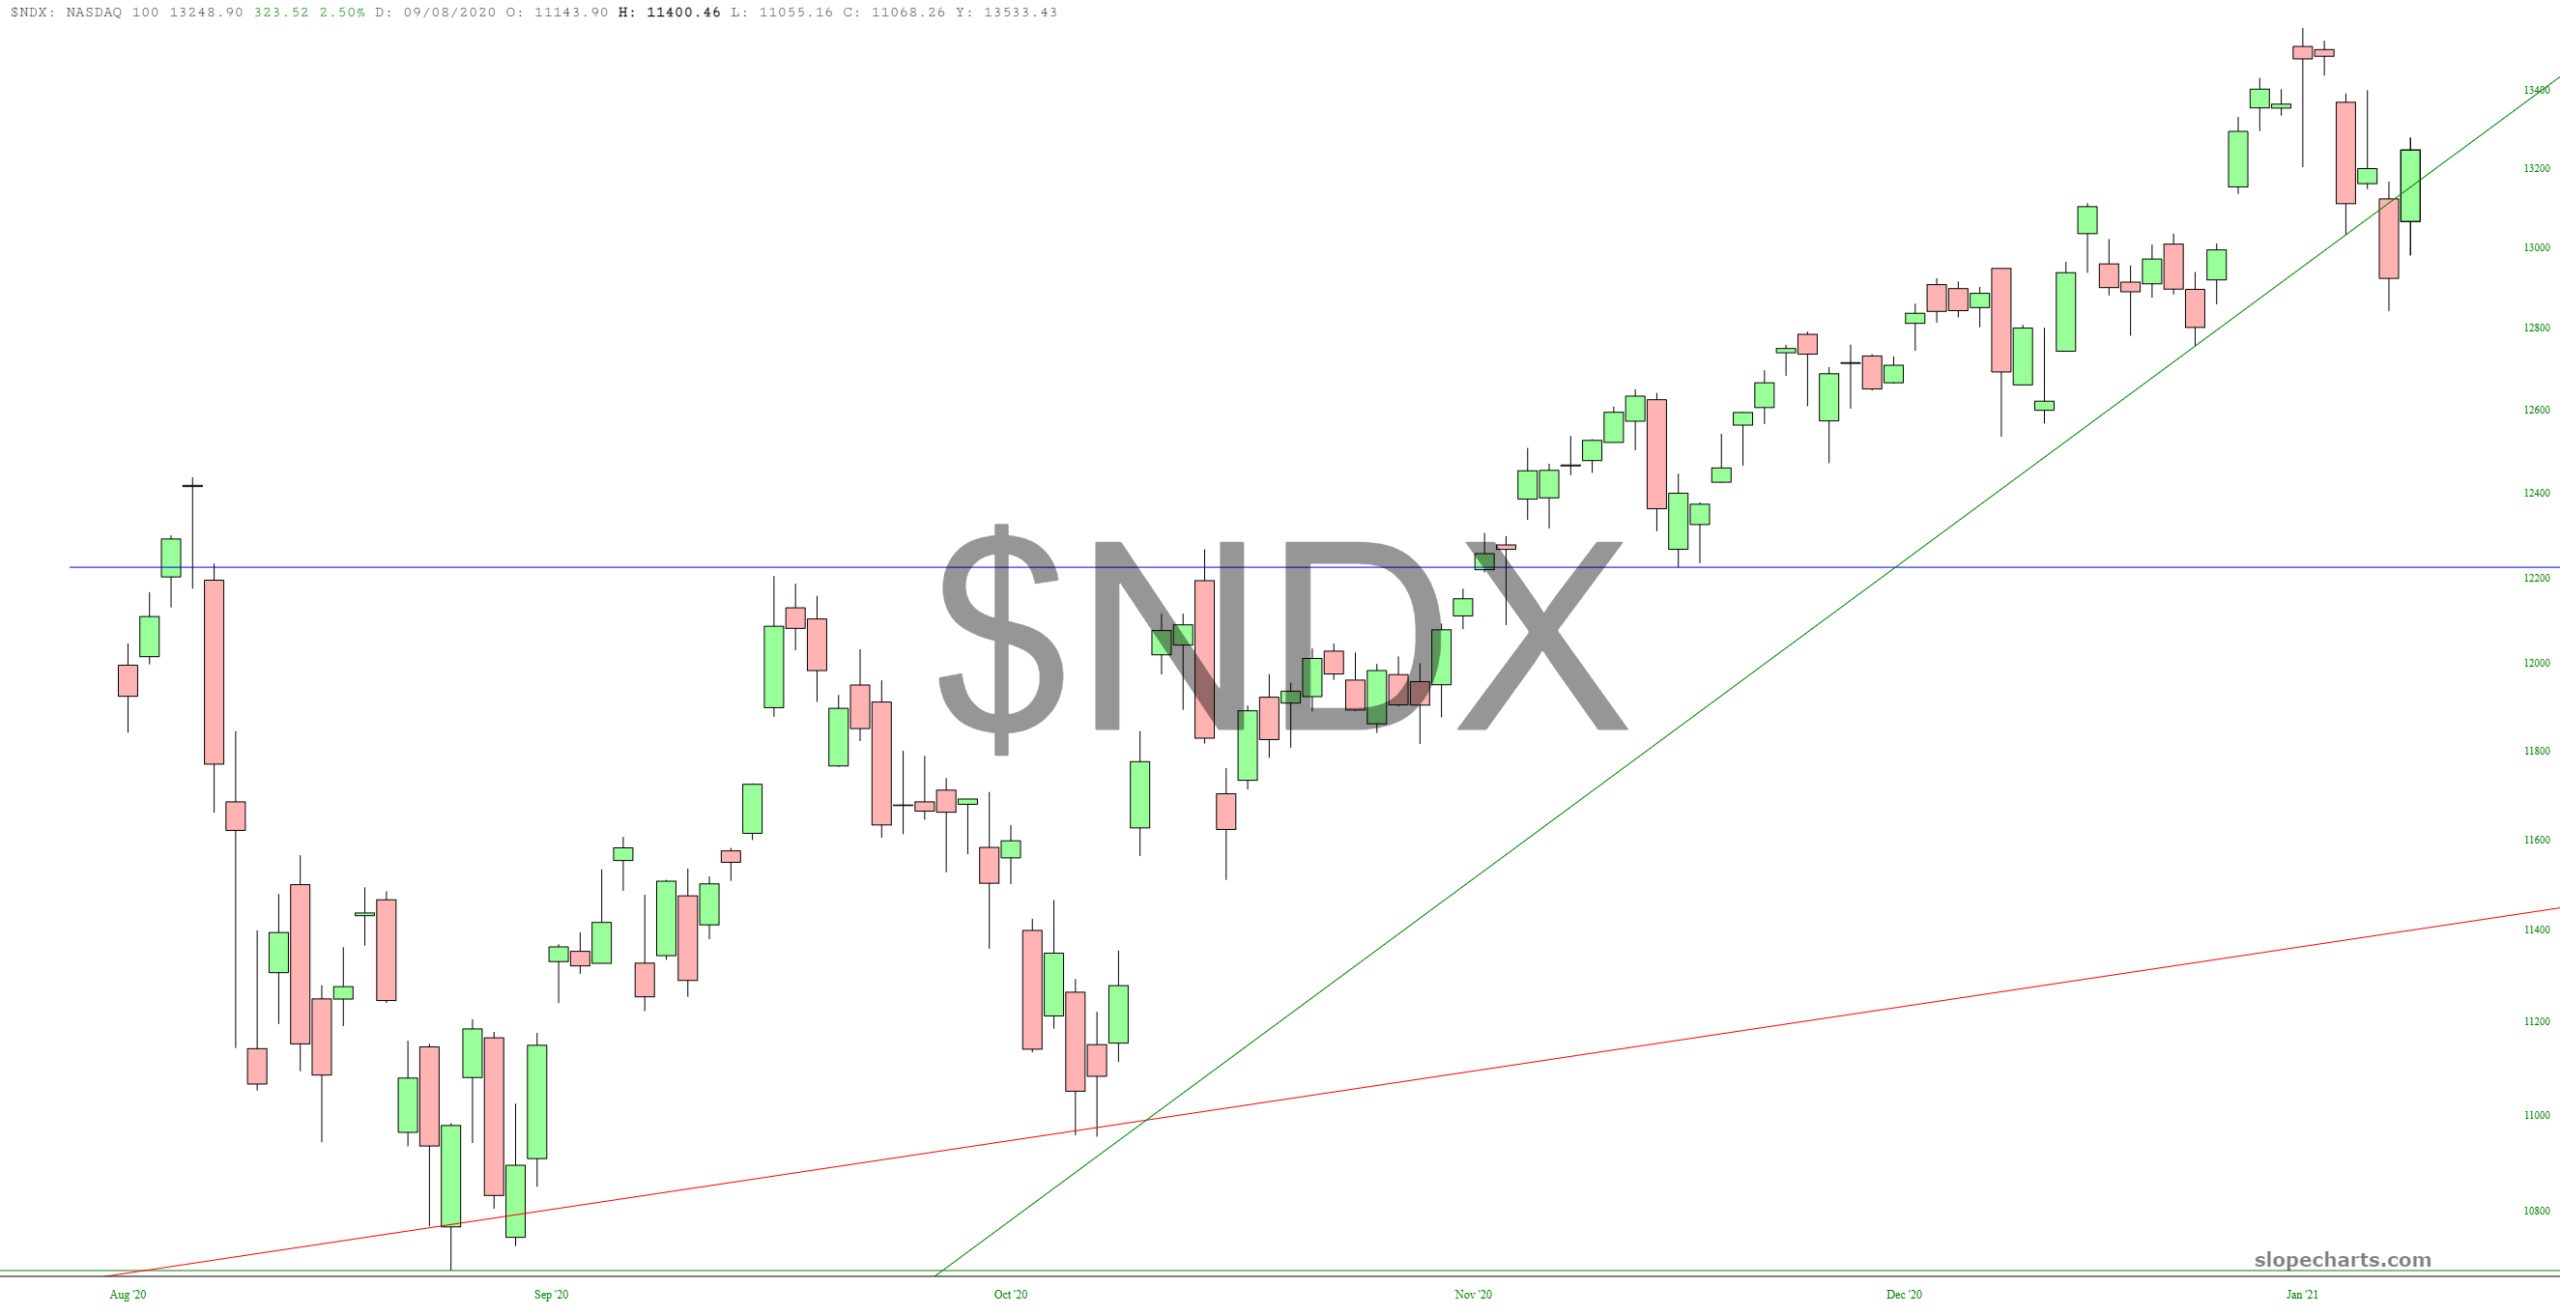
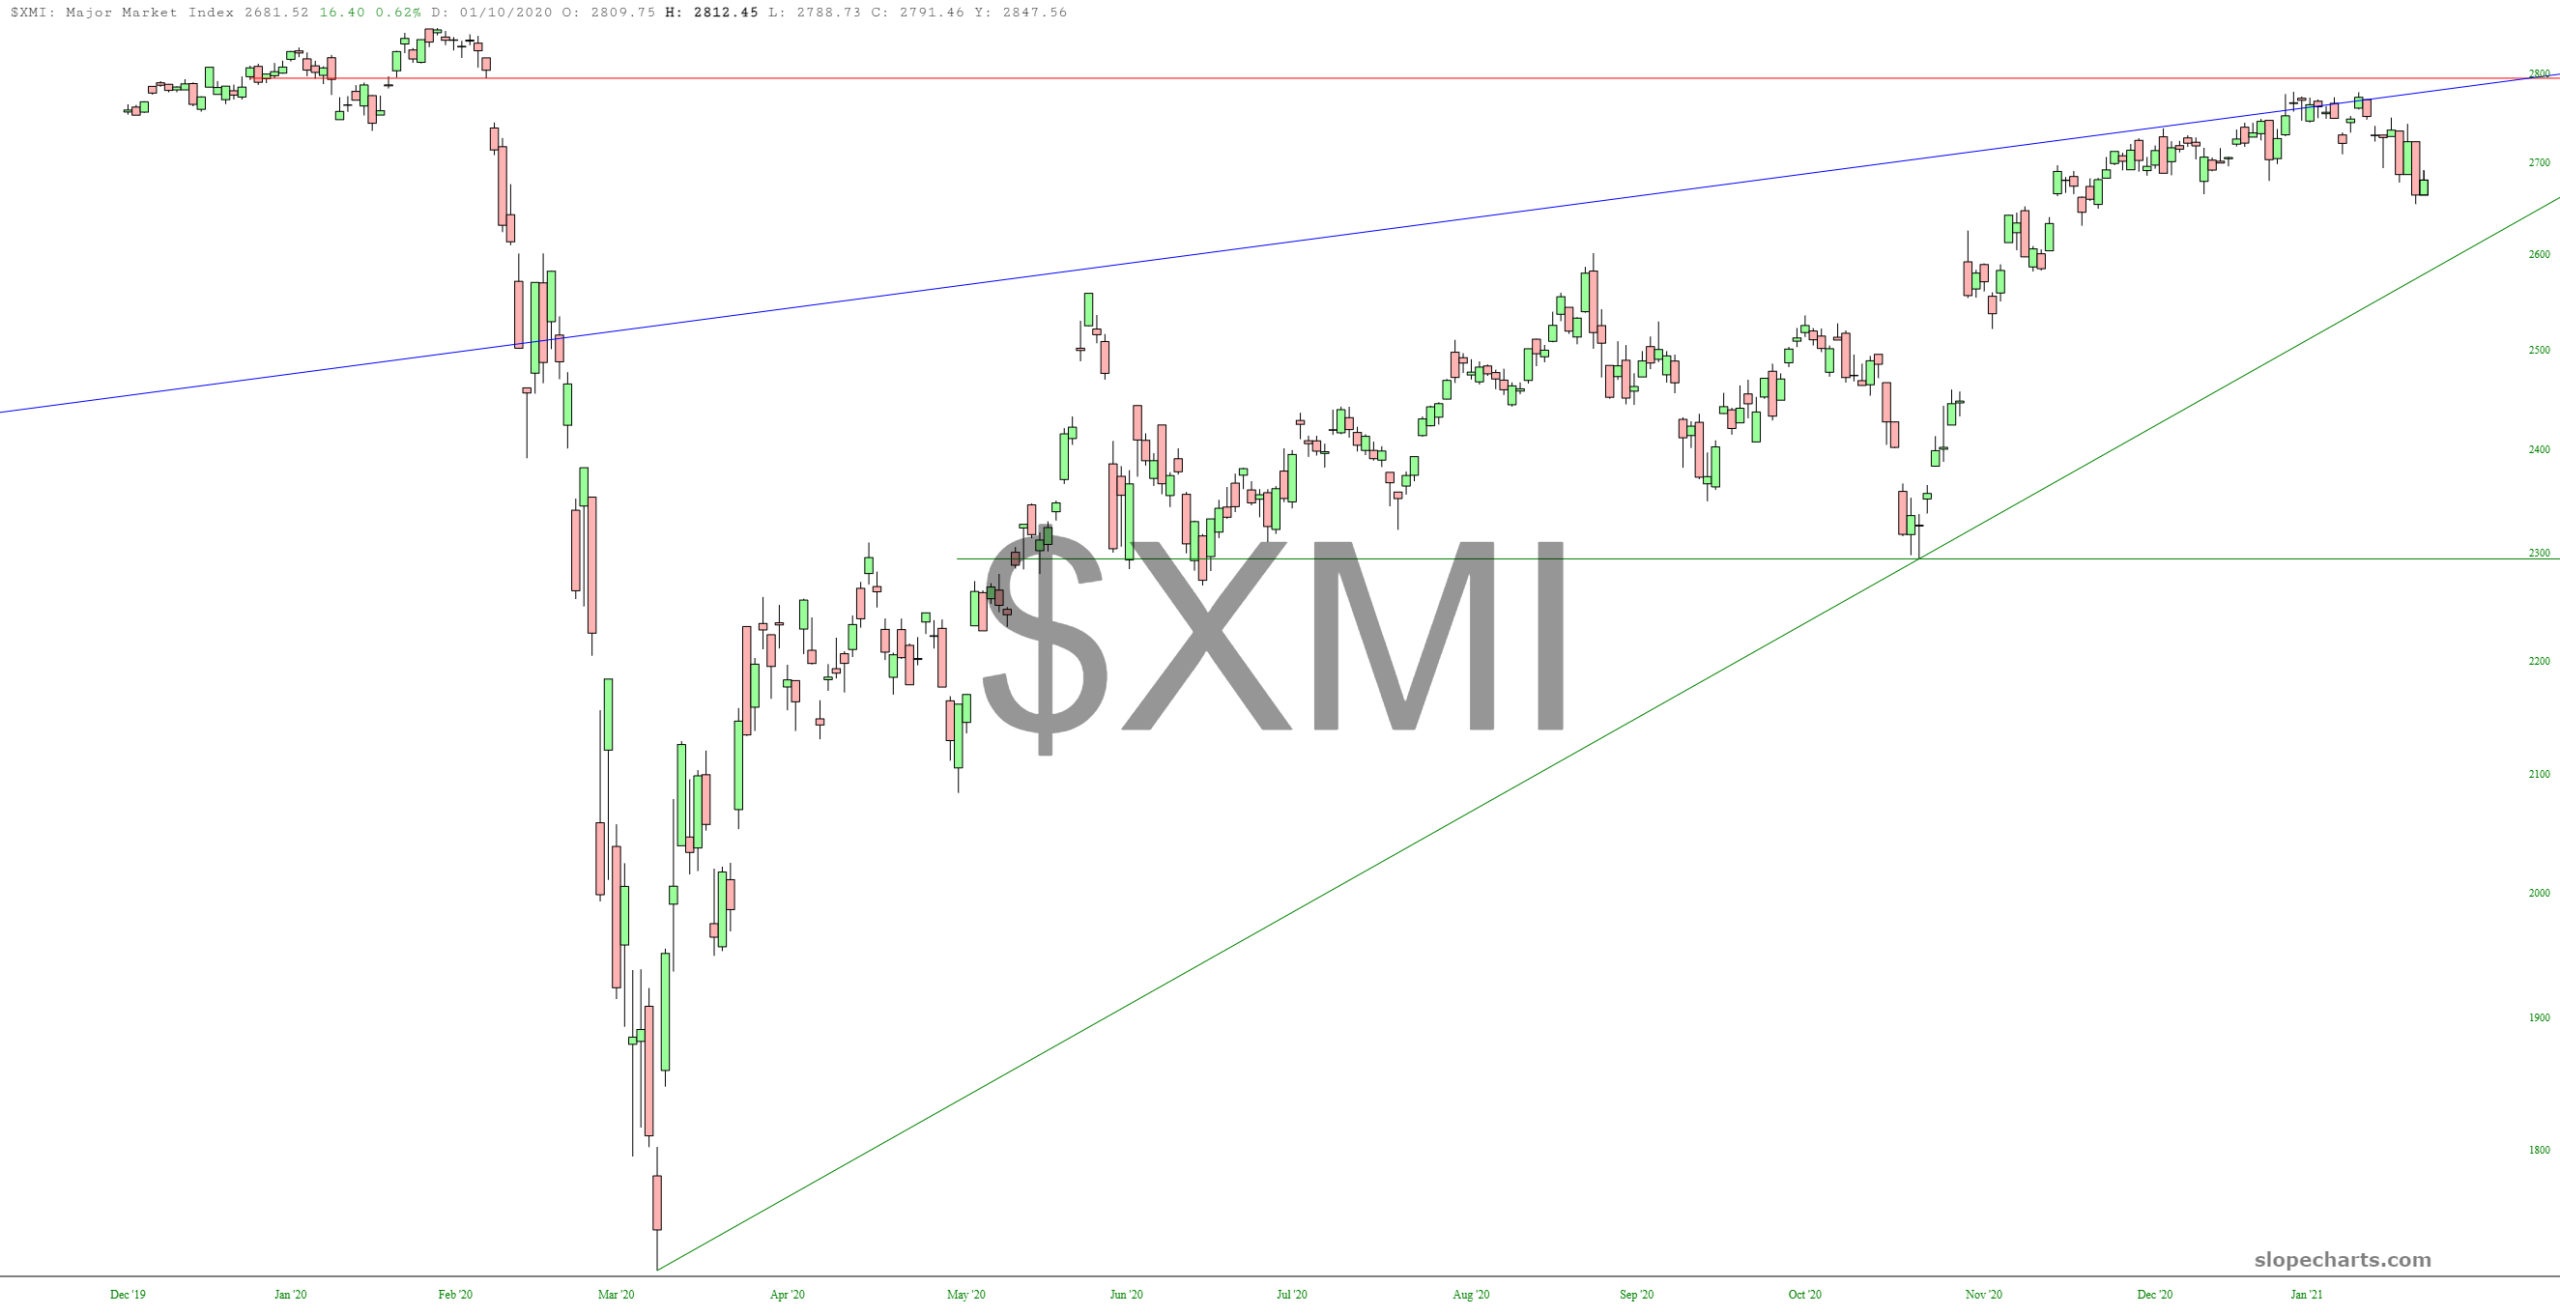
The price gap on the major market index help up beautifully.
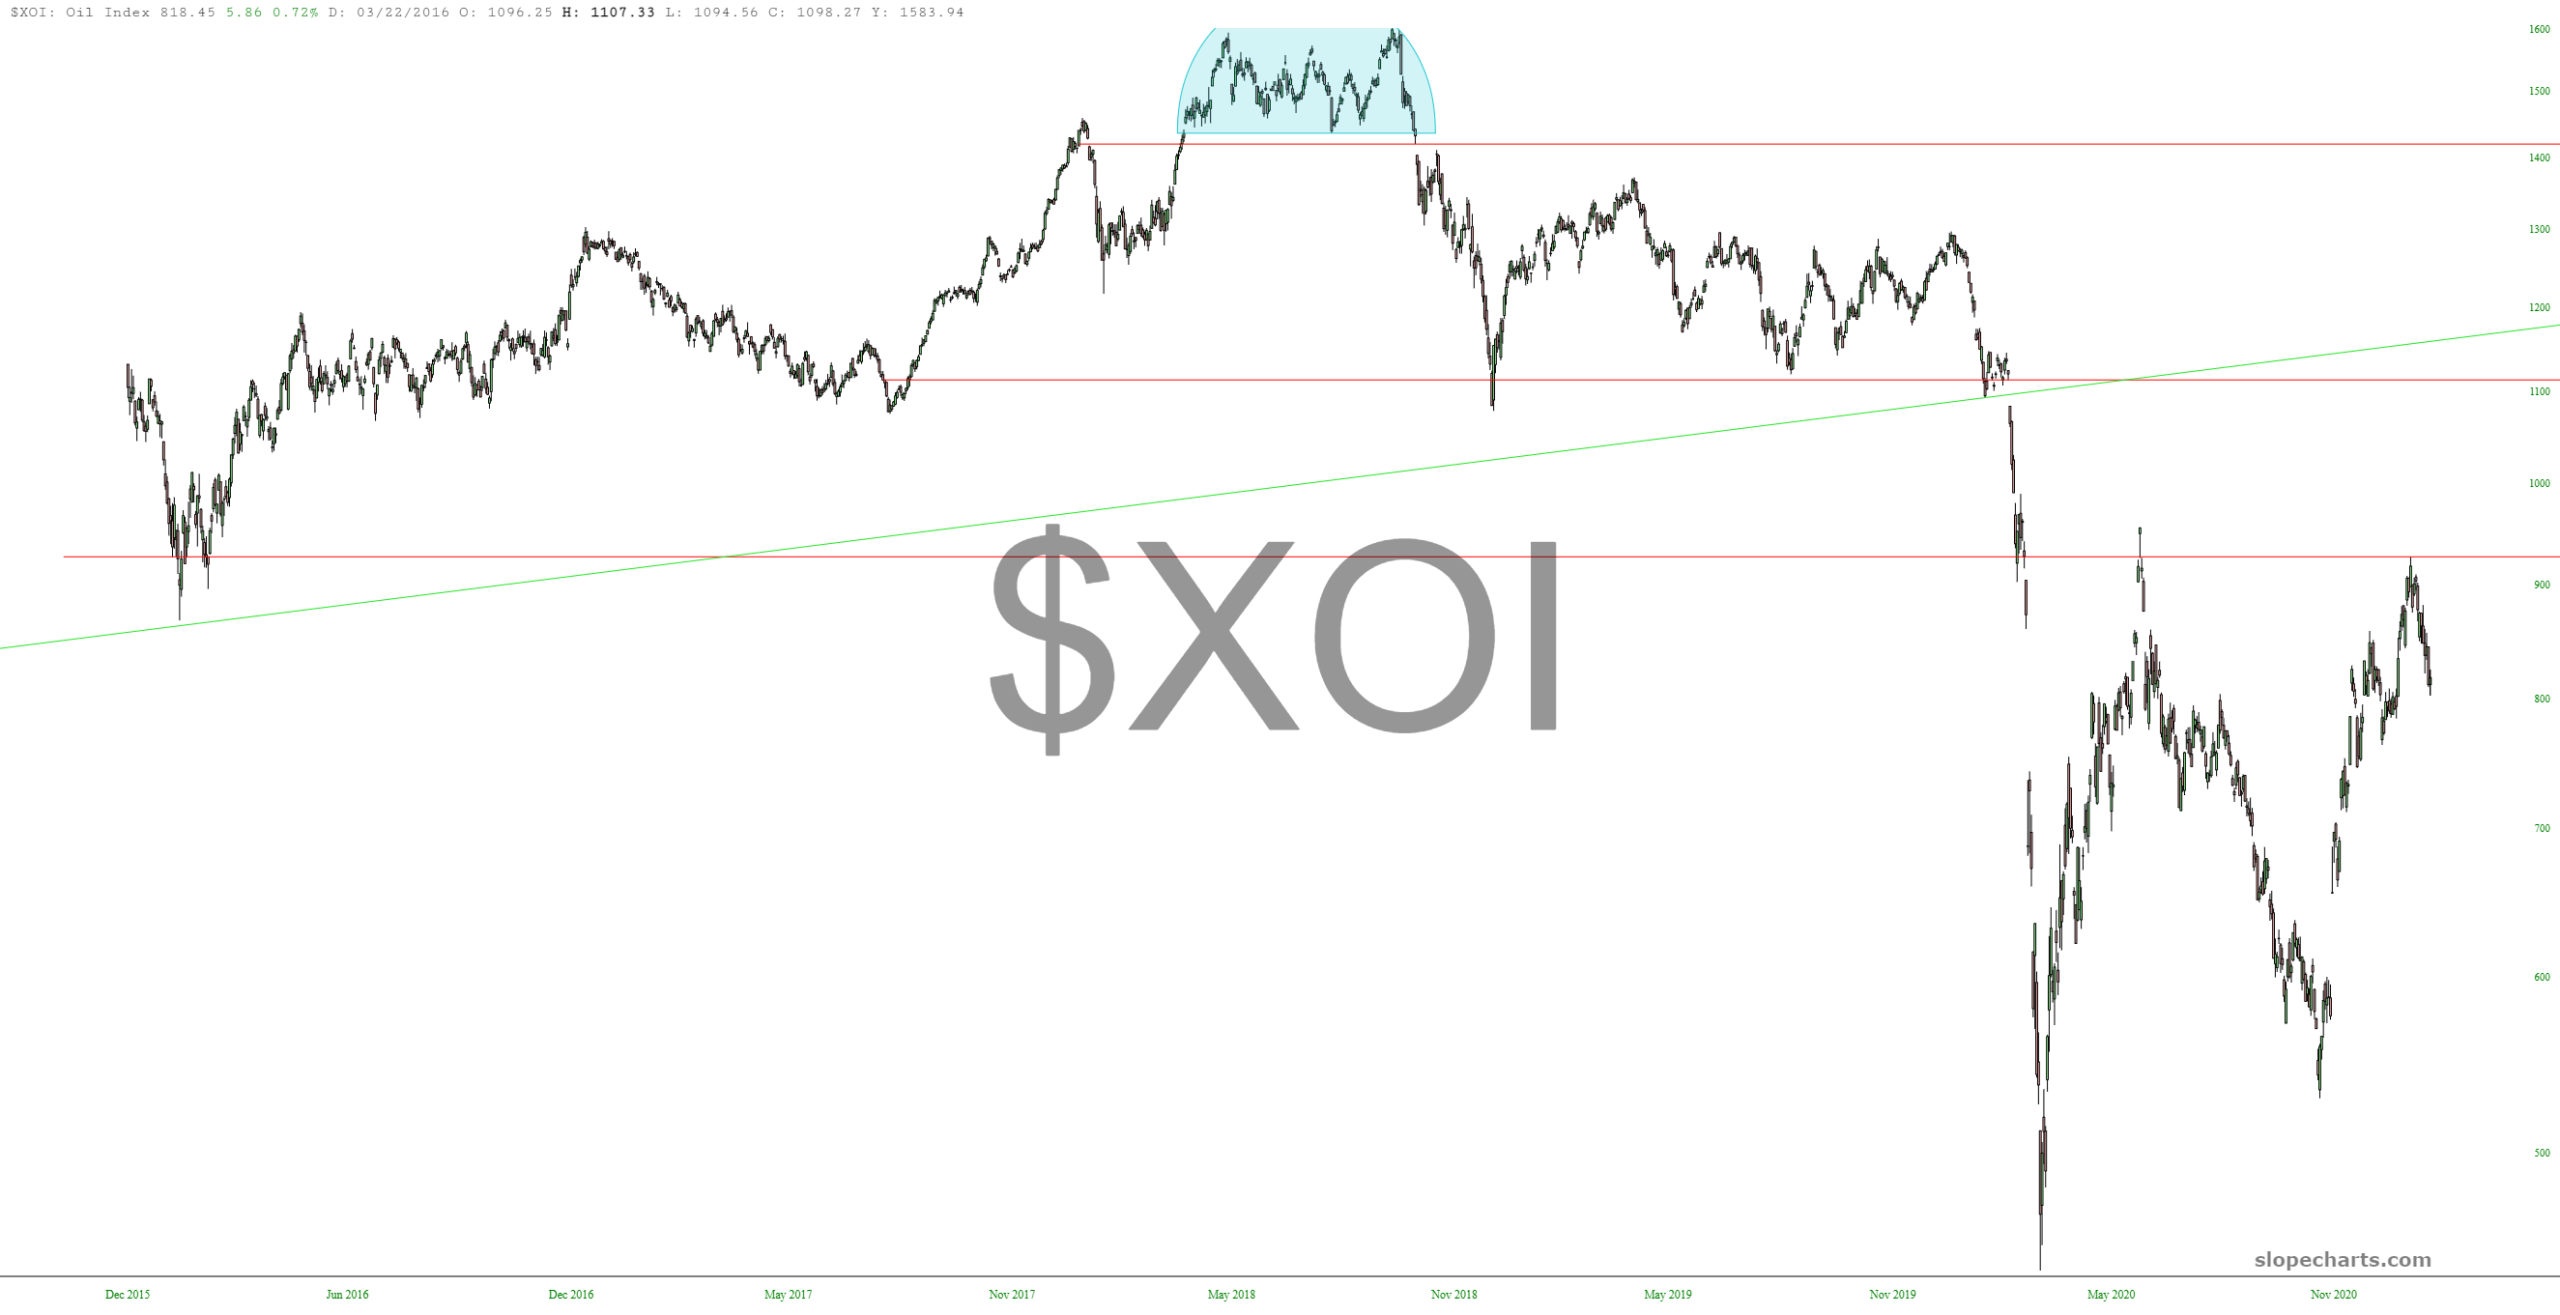
Finally, energy – – still my favorite! — has an extraordinary amount of overhead supply still working in the favor of the bears.
As I’ve mentioned, I think this whole reddit/GME/AMC zaniness is going to be a distant memory by March 1st. I’m vastly more interested to see what happens with AMZN earnings tomorrow after the close.
