We’ve added a couple of more indicators recently (Stochastics and StochRSI), which brings us to a nice, round thirty. I wanted to take a moment to say a few things about indicators, which are all documented in the SlopeCharts reference guide.

Slope initially began as a blog, so this is where most of the website’s content resides. Here we have tens of thousands of posts dating back over a decade. These are listed in reverse chronological order. Click on any category icon below to see posts tagged with that particular subject, or click on a word in the category cloud on the right side of the screen for more specific choices.
We’ve added a couple of more indicators recently (Stochastics and StochRSI), which brings us to a nice, round thirty. I wanted to take a moment to say a few things about indicators, which are all documented in the SlopeCharts reference guide.
This is interesting: click on it for a readable image.
In the end, I believe, we’ll all look back at the whole WSB subreddit and laugh. The breakdown is already starting. You can see it taking places in the favorite pre-pubescent redditor stocks:

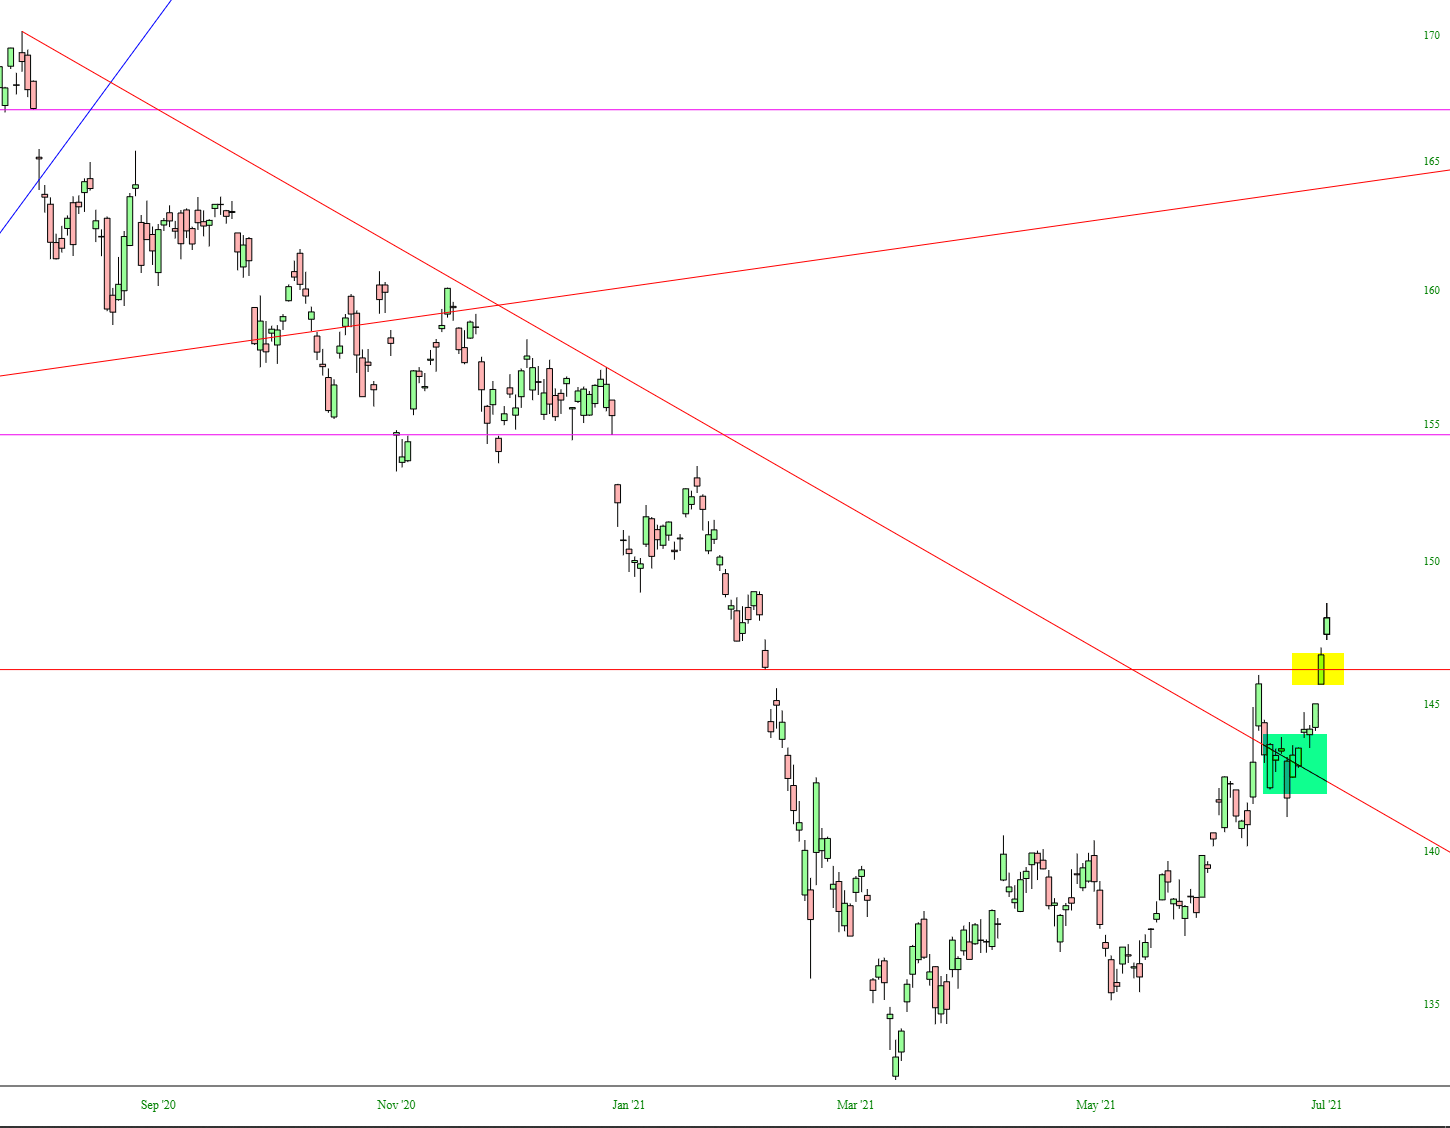
US Treasury Bonds (represented by way of TLT, shown below) has succeeded in two important breakouts: the descending trendline (green tint) and the price gap horizontal (yellow tint).