Tesla’s strength has been remarkable lately, blowing past the top of the intraday range at 1132. Now the next logical resistance point is that price gap I’ve highlighted on the daily chart:

Slope initially began as a blog, so this is where most of the website’s content resides. Here we have tens of thousands of posts dating back over a decade. These are listed in reverse chronological order. Click on any category icon below to see posts tagged with that particular subject, or click on a word in the category cloud on the right side of the screen for more specific choices.
Tesla’s strength has been remarkable lately, blowing past the top of the intraday range at 1132. Now the next logical resistance point is that price gap I’ve highlighted on the daily chart:
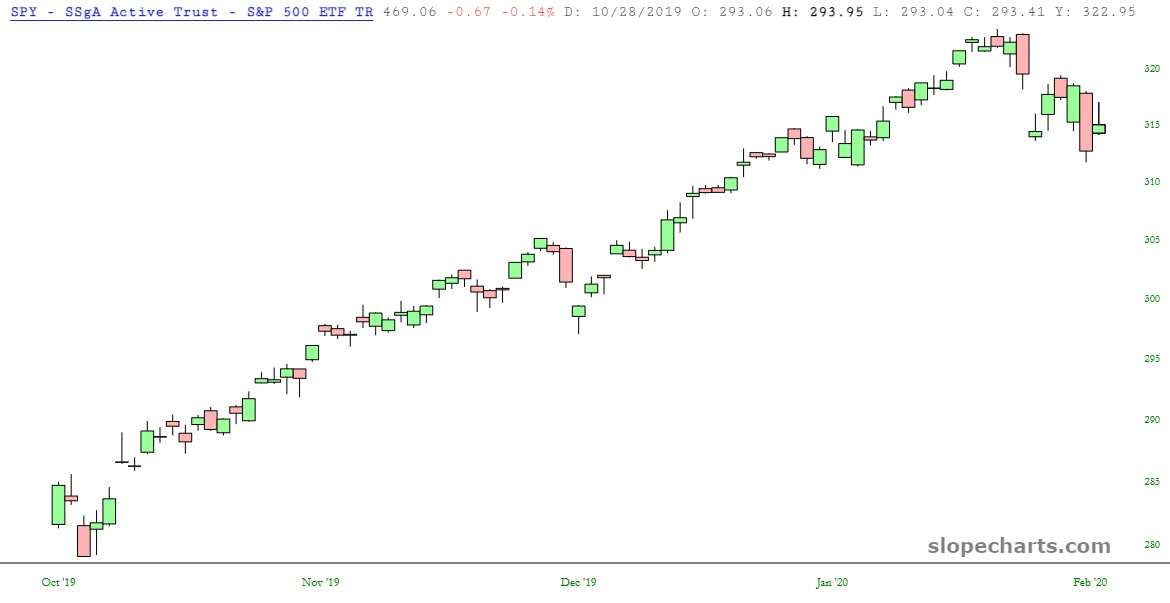
Given the joyous little dip we finally got in energy the preceding week, I am reminded vividly of late January 2020. If you’ll observe the graph of the SPY below, you’ll see that day after day, week after week, month after month, the market went relentlessly higher. Then – – finally – – we got a few days of selling! Glory be! I remember it so well, because I excitedly finally dumped my put options, garnering gains of 10%, 20%, and so on. Huzzah!!!