At the risk of pulling a Jim Cramer and simply saying the market could either go up or go down, I wanted to make an attempt at being open-minded and showing the most bullish (and, of course, bearish) charts as we head into the big FOMC day on Wednesday. I’ll be glad when the whole charade is over, but face it, we must. Below, even split, are six bullish charts and six bearish ones.
Bullish
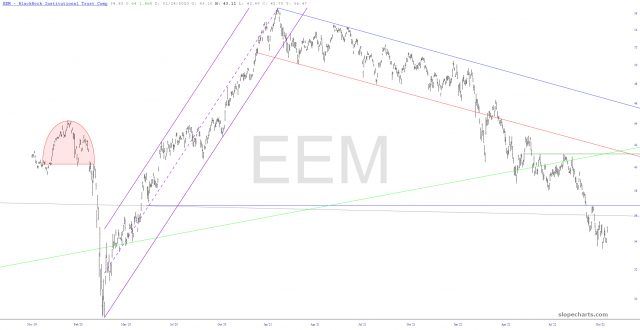
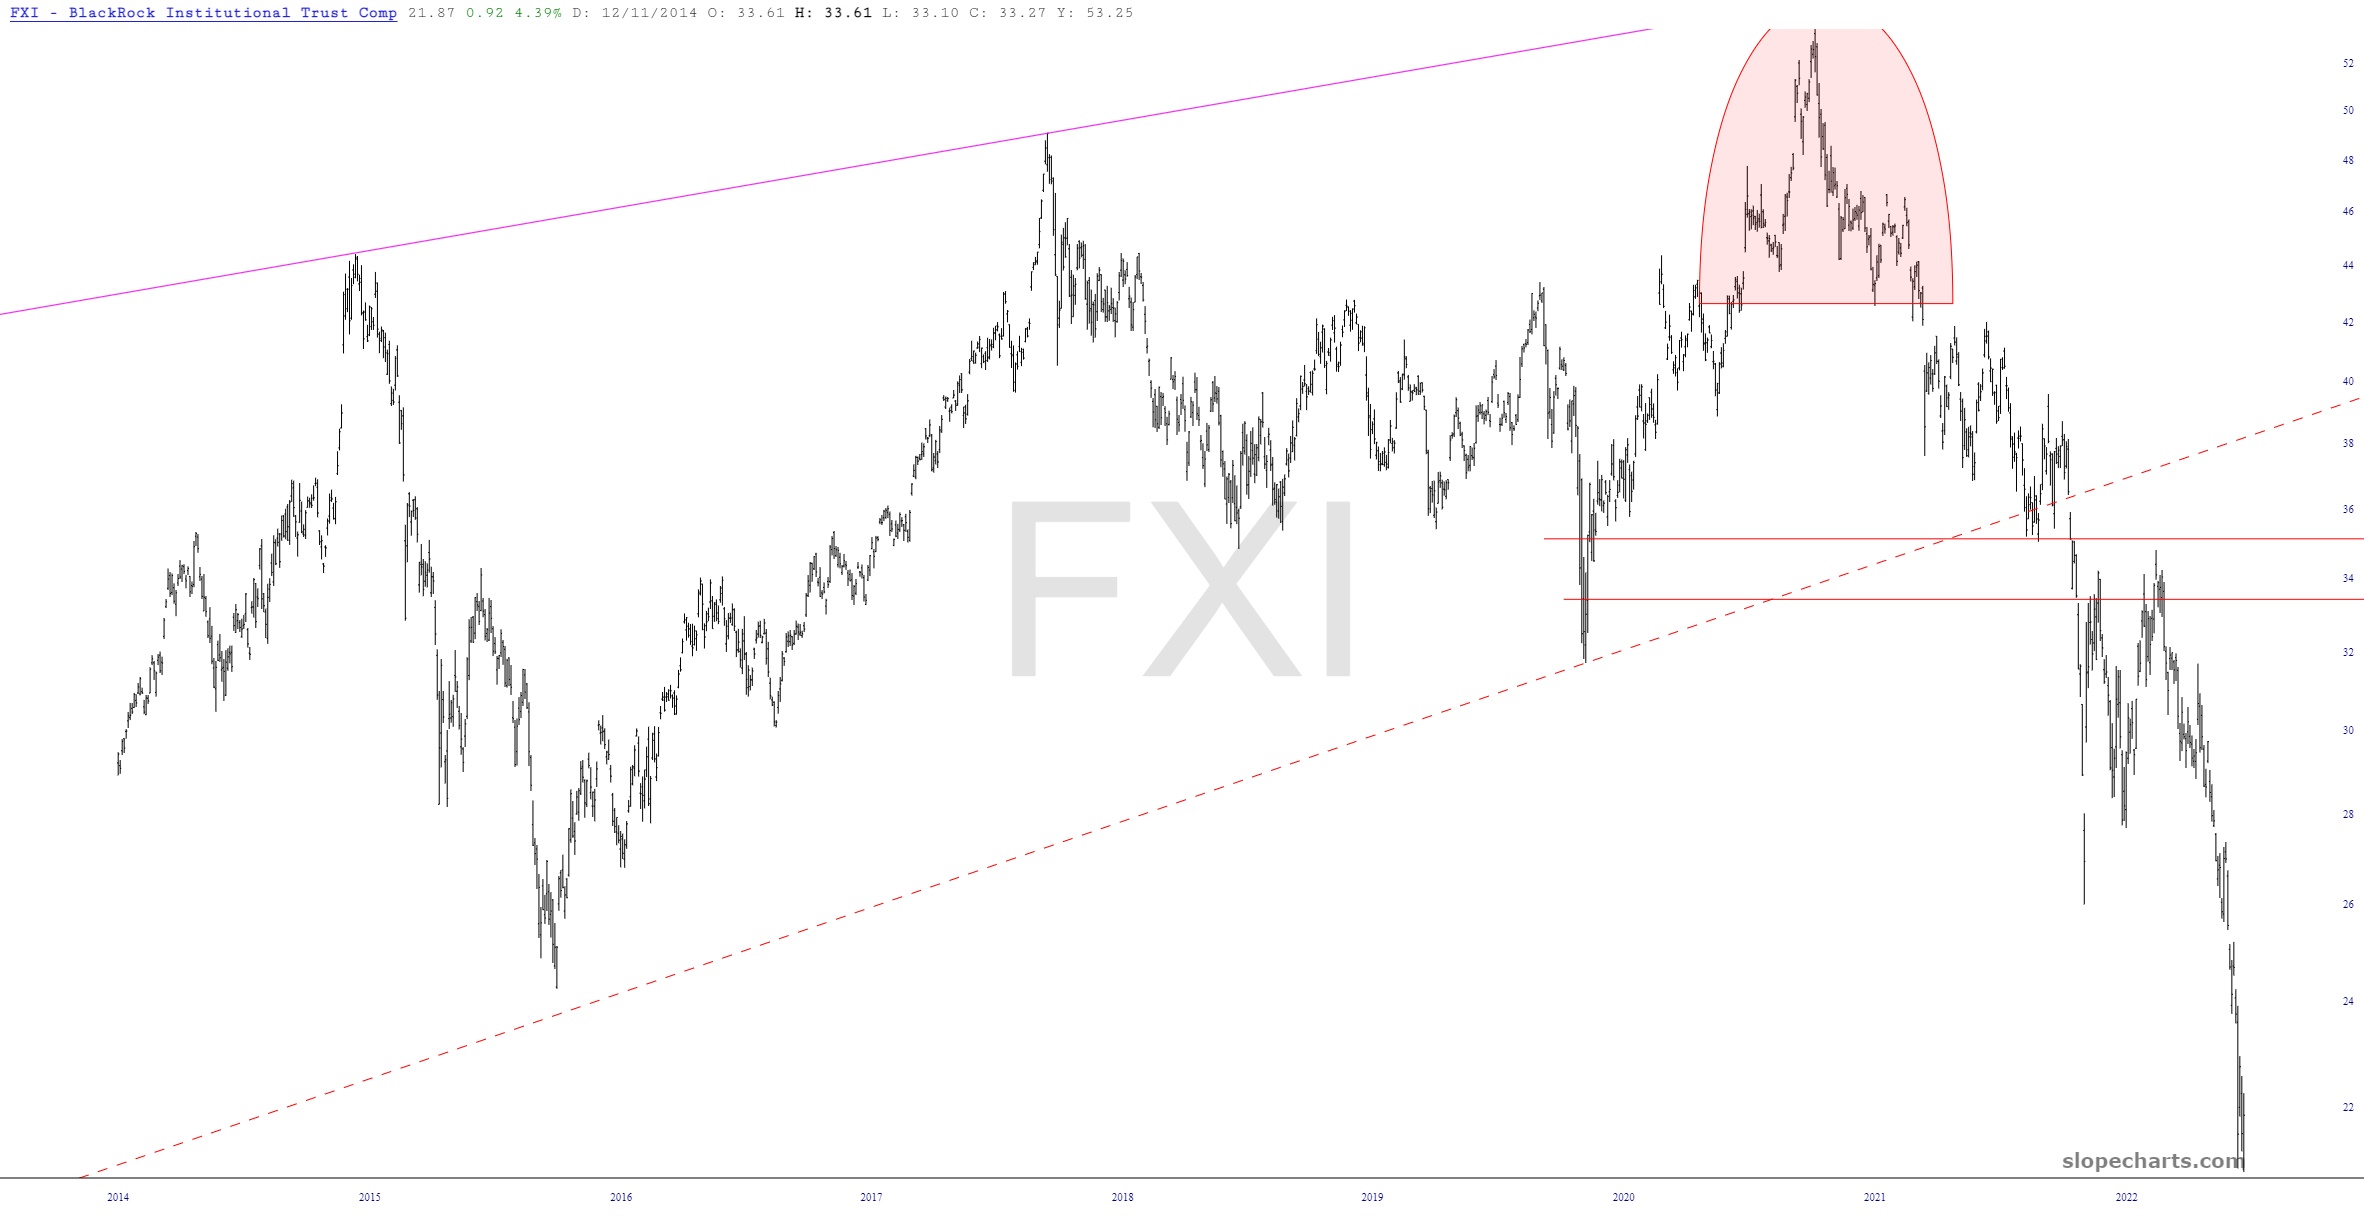
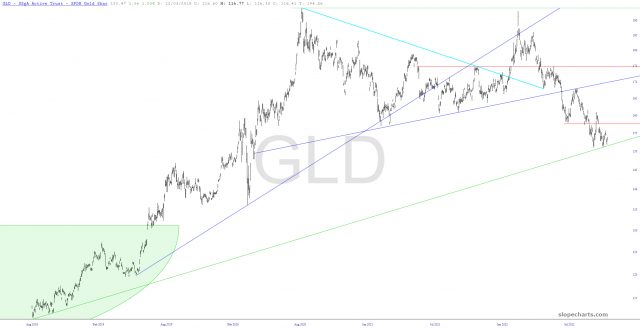
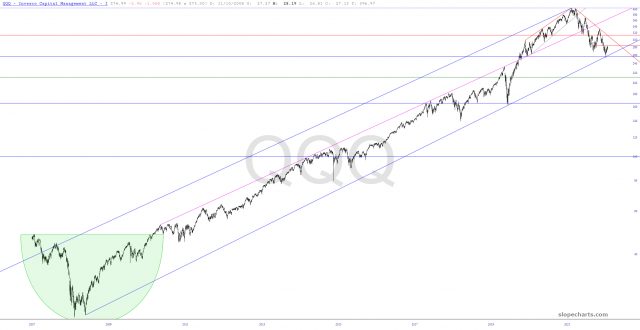
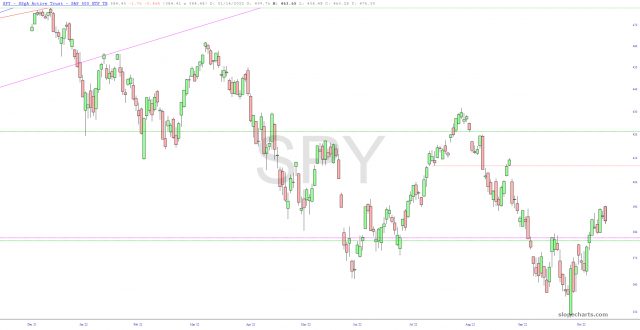
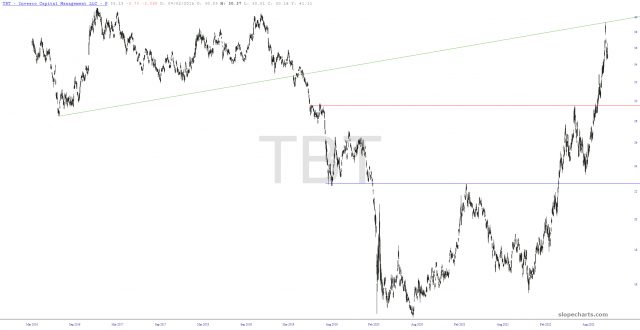
This, and other charts in this section, aren’t bullish per se, but they have been beaten so severely that there’s an argument to be made for a hearty, sustained bounce. There’s actually nothing bullish about it in the least, but it’s got a very long way to go on the upside before it encounters substantial resistance.Here is an even more extreme example, with China smashed into the floor. This could be the “trying to hold a ball under the water” kind of situation, since prices are so low.Gold is teetering on its trendline. As long as it doesn’t break it, there’s opportunity for healing.There was a major (and painful) bottom on October 13th, which found support on both the Fibonacci retracement as well as the very long-term supporting trendline.Perhaps the most concerning of all is the HUGE amount of upside potential between present price levels and the September 12/13 gap. That would get us well over 4,000 on the S&P.Finally, interest rates have go up so far, and so fast, it’s plausible they have peaked and are going to be easing back.
Bearish
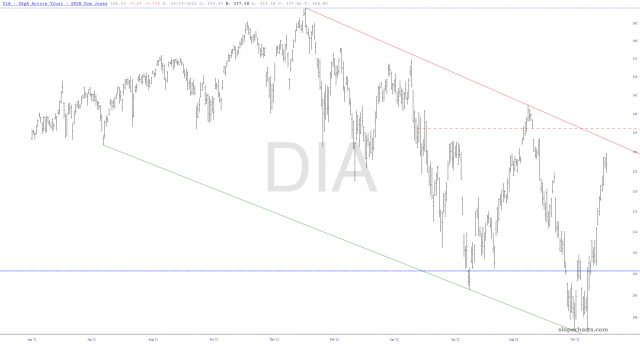
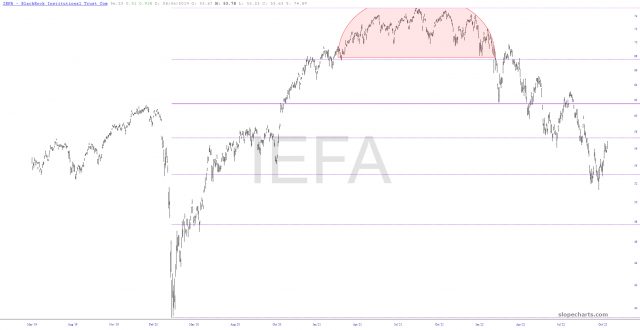
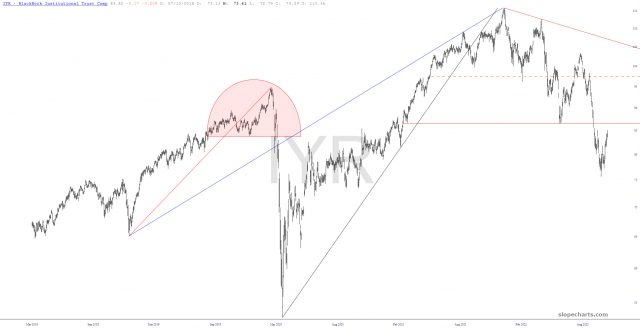
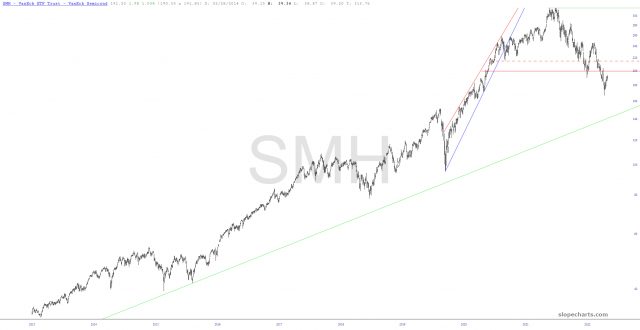
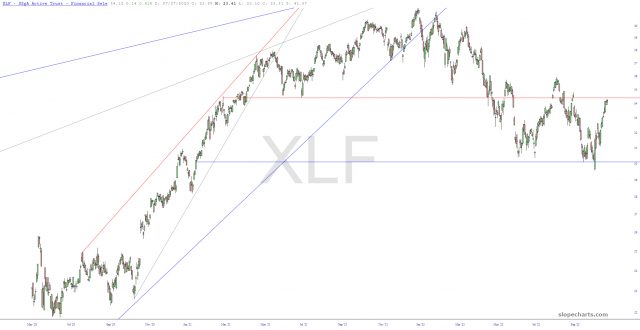
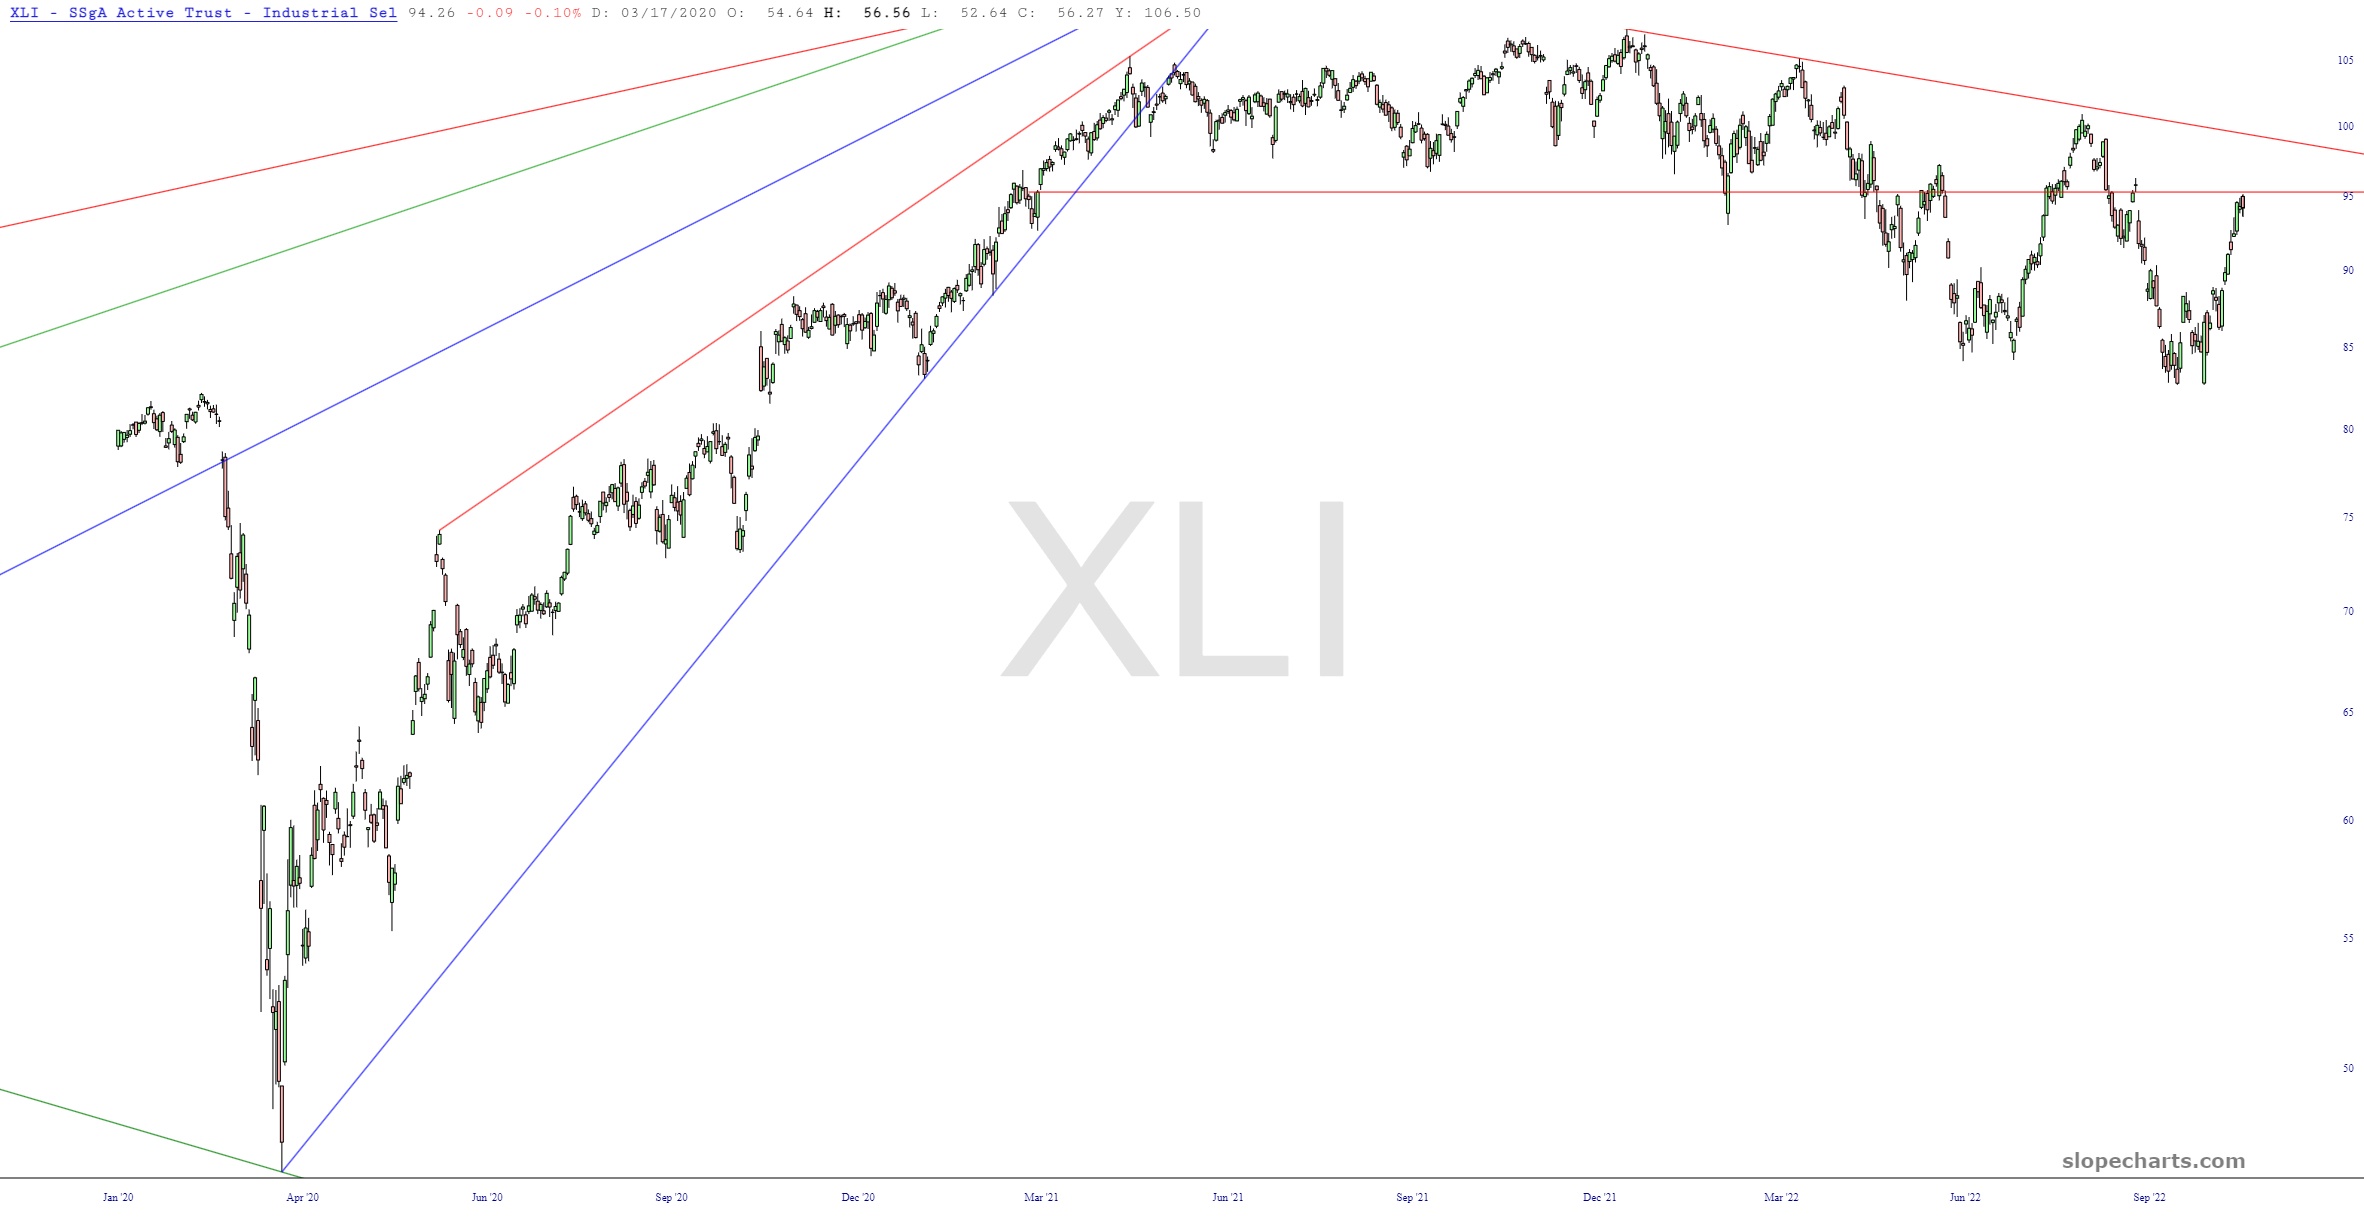
The price gap and the descending trendline are both important barriers, and this ‘zig zag” lower seems to be following a smooth pathInternational markets have ascended to an important resistance point, which is beneath the Fibonacci as well as substantial overhead supplyThe undeniably bearish real estate fund has almost reached its resistance horizontalThe semiconductor sector is in a well-defined bearish pattern and is still beneath a major price gapThe financial sector is a crucial decision-maker as to whether the markets will strengthen or weaken; this is an exceptionally good top.Finally, the only ETF in which I have a position, this has respected its Sept 12/13 price gap and is prone to a resumption of weakness beneath the horizontal.