A Word of Warning
My friend Andy Swan, co-founder of the social data firm LikeFolio, tends to have a positive outlook on things, but he offered a word of warning after seeing Tuesday’s market muted reaction in the wake of the cooler-than-expected CPI print:
This morning, the BLS released its November Core Price Index, showing a 7.1% year-over-year inflation rate.
This was below the 7.3% that the market expected.This “cooling” inflation level leads many on Wall Street to anticipate that the Federal Reserve will be less concerned about inflation, and therefore less aggressive about raising interest rates.
As a result, stocks immediately popped 2-3% on the CPI report.
Why I’m concerned…By 10:30 am ET this morning, an hour after the opening bell, the S&P 500 had given back over half of its initial gains.
This lack of follow-through (at least initially) tells me that we are missing the two things that drove the market rally following last month’s CPI report: Short-covering and FOMO (fear of missing out) by hedge funds who had spent most of 2022 in a defensive posture and were forced to switch by the encouraging downtick in inflation last month.
Yes, 7.1% inflation is still down from last month, and lower than overall expectations – but 7.1% is still not a great number.
And that’s what I’m guessing the FED is thinking as well.
After spending all of 2021 ridiculously claiming that inflation was “transitory”… I don’t think they want to be seen as being weak on inflation again.
So I believe they’ll err to the aggressive side on interest rates.
I expect that tomorrow we’ll see the full 50 basis point increase that the market expects, and very little in the way of “pivoting” language from Powell.
This “reality check” from the FED could disappoint investors, and cause the market to give back all of its recent gains and then some… likely resuming the yearlong downtrend in stocks that has plagued the market.
I hope I’m wrong, but I believe caution is warranted from here.Risk to the downside through the end of 2022, with an increase in volatility likely from today’s low levels.“Fed Prediction: Pain” via LikeFolio
Consider Adding Downside Protection
It might be worth taking advantage of the current low volatility and higher market to add some downside protection now. Below is a simple way of doing so.
For the purposes of this example, we’ll assume your portfolio is worth $500,000, and that it’s closely correlated with the SPDR S&P 500 Trust (SPY). We’ll also assume you have enough diversification within it to protect against stock-specific risk, and that you can tolerate a decline of up to 20%. If you have a smaller risk tolerance, you can use the same approach entering a smaller decline threshold, Similarly, if you have a larger or smaller portfolio, you can adjust Step 1 below accordingly. If you have bonds, or other asset classes in your portfolio, we’ll address that at the end.
Hedging Stock Market Risk
Step 1
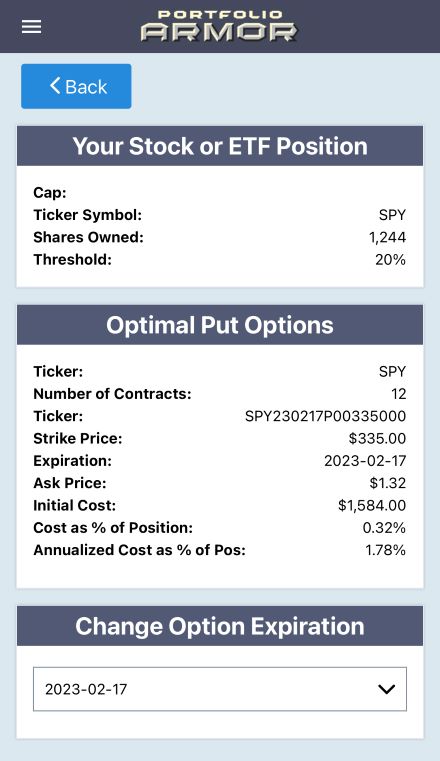
Divide the dollar value of your portfolio by the current price of SPY. For this example, we’ll use numbers as of Tuesday’s close, but obviously, you’ll use current data when you do it. SPY closed at $401.97 on Tuesday. Dividing $500,000 by $401.97 gets you 1,244 shares (rounding up to the nearest whole share).
Step 2
Scan for the optimal, or least expensive, puts to protect against a >20% decline in your number of shares of SPY at the options expiration you want. We’ve selected the February expiration below. It’s far enough out to give you some breathing room, and it’s not too expensive.

As you can see above, the number of options contracts the algorithm presented was 12. Since each options contract covers 100 shares, what our algorithm does when you enter a number containing an odd lot like 1,244 is this: it slightly over-hedges the round lots (the 1,200 shares, in this case), so that your entire position, including those extra 44 shares, is protected against the drawdown you specified.
Note the cost here: $1,584, or 0.32% of portfolio value. The app calculated that conservatively, using the ask price of the puts (in practice, you can often buy options at some price between the bid and ask prices).
Step 3
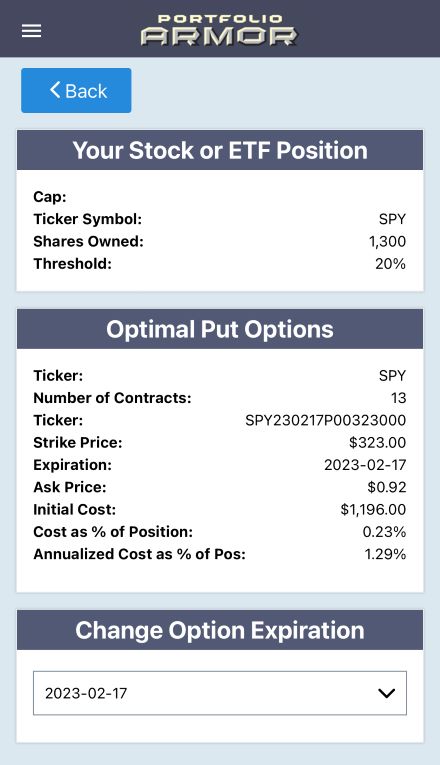
Round up the number of SPY shares to the nearest 100 and repeat step 2.

Note that, in this case, it was cheaper to hedge 1,300 shares using the second hedge, so you would go with that.
Hedging Other Asset Classes
In our simplified example above, your portfolio was 100% stocks that were highly correlated with SPY. Let’s say your portfolio includes a broader range of asset classes: 40% diversified stocks, 20% tech stocks, 40% bonds. You could use the same approach as above using the Invesco QQQ Trust (QQQ) as the ticker for the tech stocks, the iShares 20+ Year Treasury Bond ETF (TLT) or the iShares iBoxx $ Investment Grade Corporate Bond ETF (LQD) for the bonds (depending if they’re Treasuries or corporates). So, in that case, you’d divide the dollar amount of your tech stocks by the current price of QQQ, etc.


