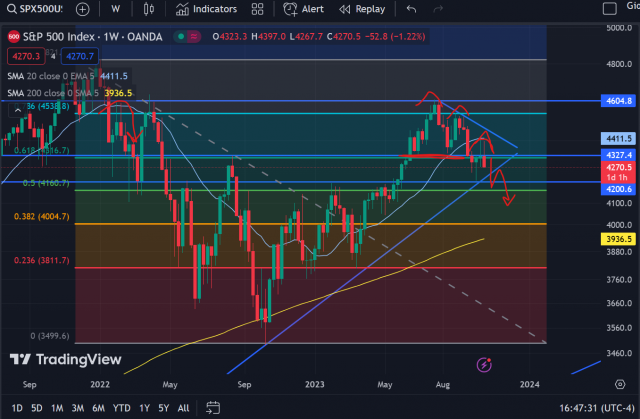
I had a post last week which I mused the possibility of repeating the rejection pattern we saw early 2022, specifically the initial breakdown week and subsequent bounce and retest underneath the 20 week MA. We (so far) have been putting in an almost identical weekly rejection (even this week’s large upper wick) with a red candlestick body basically undoing the prior week’s bullish green candle. Well, it is Thursday and so far, so good.

I’ve already laid out my path last week, so I won’t retread old ground. But I do want to point out a few things that favor my continued bearish outlook.
First, the weekly rejection of that 20 Week MA is working very nicely. Secondly, this week marks a failure to stay above the 61.8% Fibonacci Retracement Level (drawn from Market high in late 2021 to Market low in October 2022). Thirdly, last week and this week put in a third lower high and couldn’t muster a continuation rally. Lastly, today’s double rip and subsequent failure were a pretty definitive announcement of how investors are feeling. So my bet continues to be on lower prices.
Supportive levels to watch are 4246 (200 Day MA as of today, not shown), 4220 (ascending trendline drawn from COVID 2020 lows through October 2022 lows), and 4200 (big round number). With the failure of this week to really take off, I am expecting a test of 4200 at least by next week. Perhaps we see some bouncing there, but note that if we end up hitting 4200, then that also means we will have broken both the 200 Day MA to the downside AND the ascending trendline, both of which would portend further bearishness as momentum would be turning. However, 4200 being as big and round as it is, I’d look for a short-term bounce yet again.
But this is where I’d look for prime short entry. I don’t think we break those technical patterns and manage to bottom out as well. I’ll be looking for a bounce retracement to underneath the trendline and target 4150-4160 by the end of October or Beginning of November. This is the 20 Month MA from which we still have to retest, not to mention the is also the 50% retracement between those 2021 highs and 2022 lows. I won’t speculate beyond that as there are many things which I need to see before that is clear. But I’m sure we’ll start seeing some charts from those tweets (twats?) about how “we’ve never seen a 50% retracement that didn’t rally to new highs”, blah blah blah. Maybe, maybe not. I say I’ll cross that bridge when we get there.
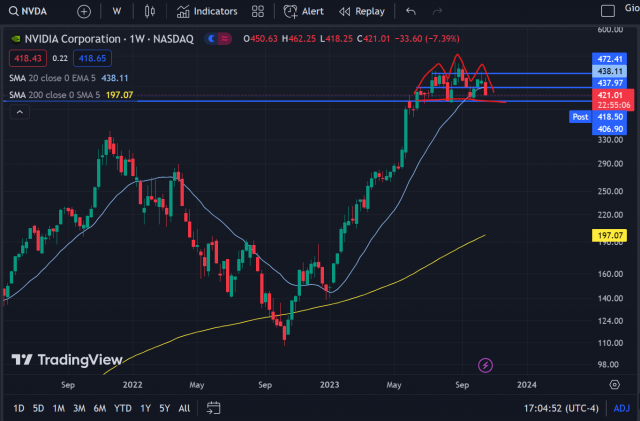
To end, I don’t have a whole smorgasbord of individual stocks which I haven’t already mentioned. But I do want to point out this enticing pattern setting up now:

I had mentioned this in late September looking for an immediate drop, but the stop levels I set broke upwards and it managed to have quite the bounce since then. I did notice resistance potential around 471, but regardless, I give myself an F on trading it because I caught NONE of this move back down so far. However, if the market really takes a crap, then this is still worth a bet on breaking beneath 400 for a decent chunk of change from this H&S Pattern. (Editor’s note: I am proudly short NVDA by way of puts!)

