Gold mining stock charts have not yet confirmed a sustainable rally, and Q3 fundamentals may be a headwind
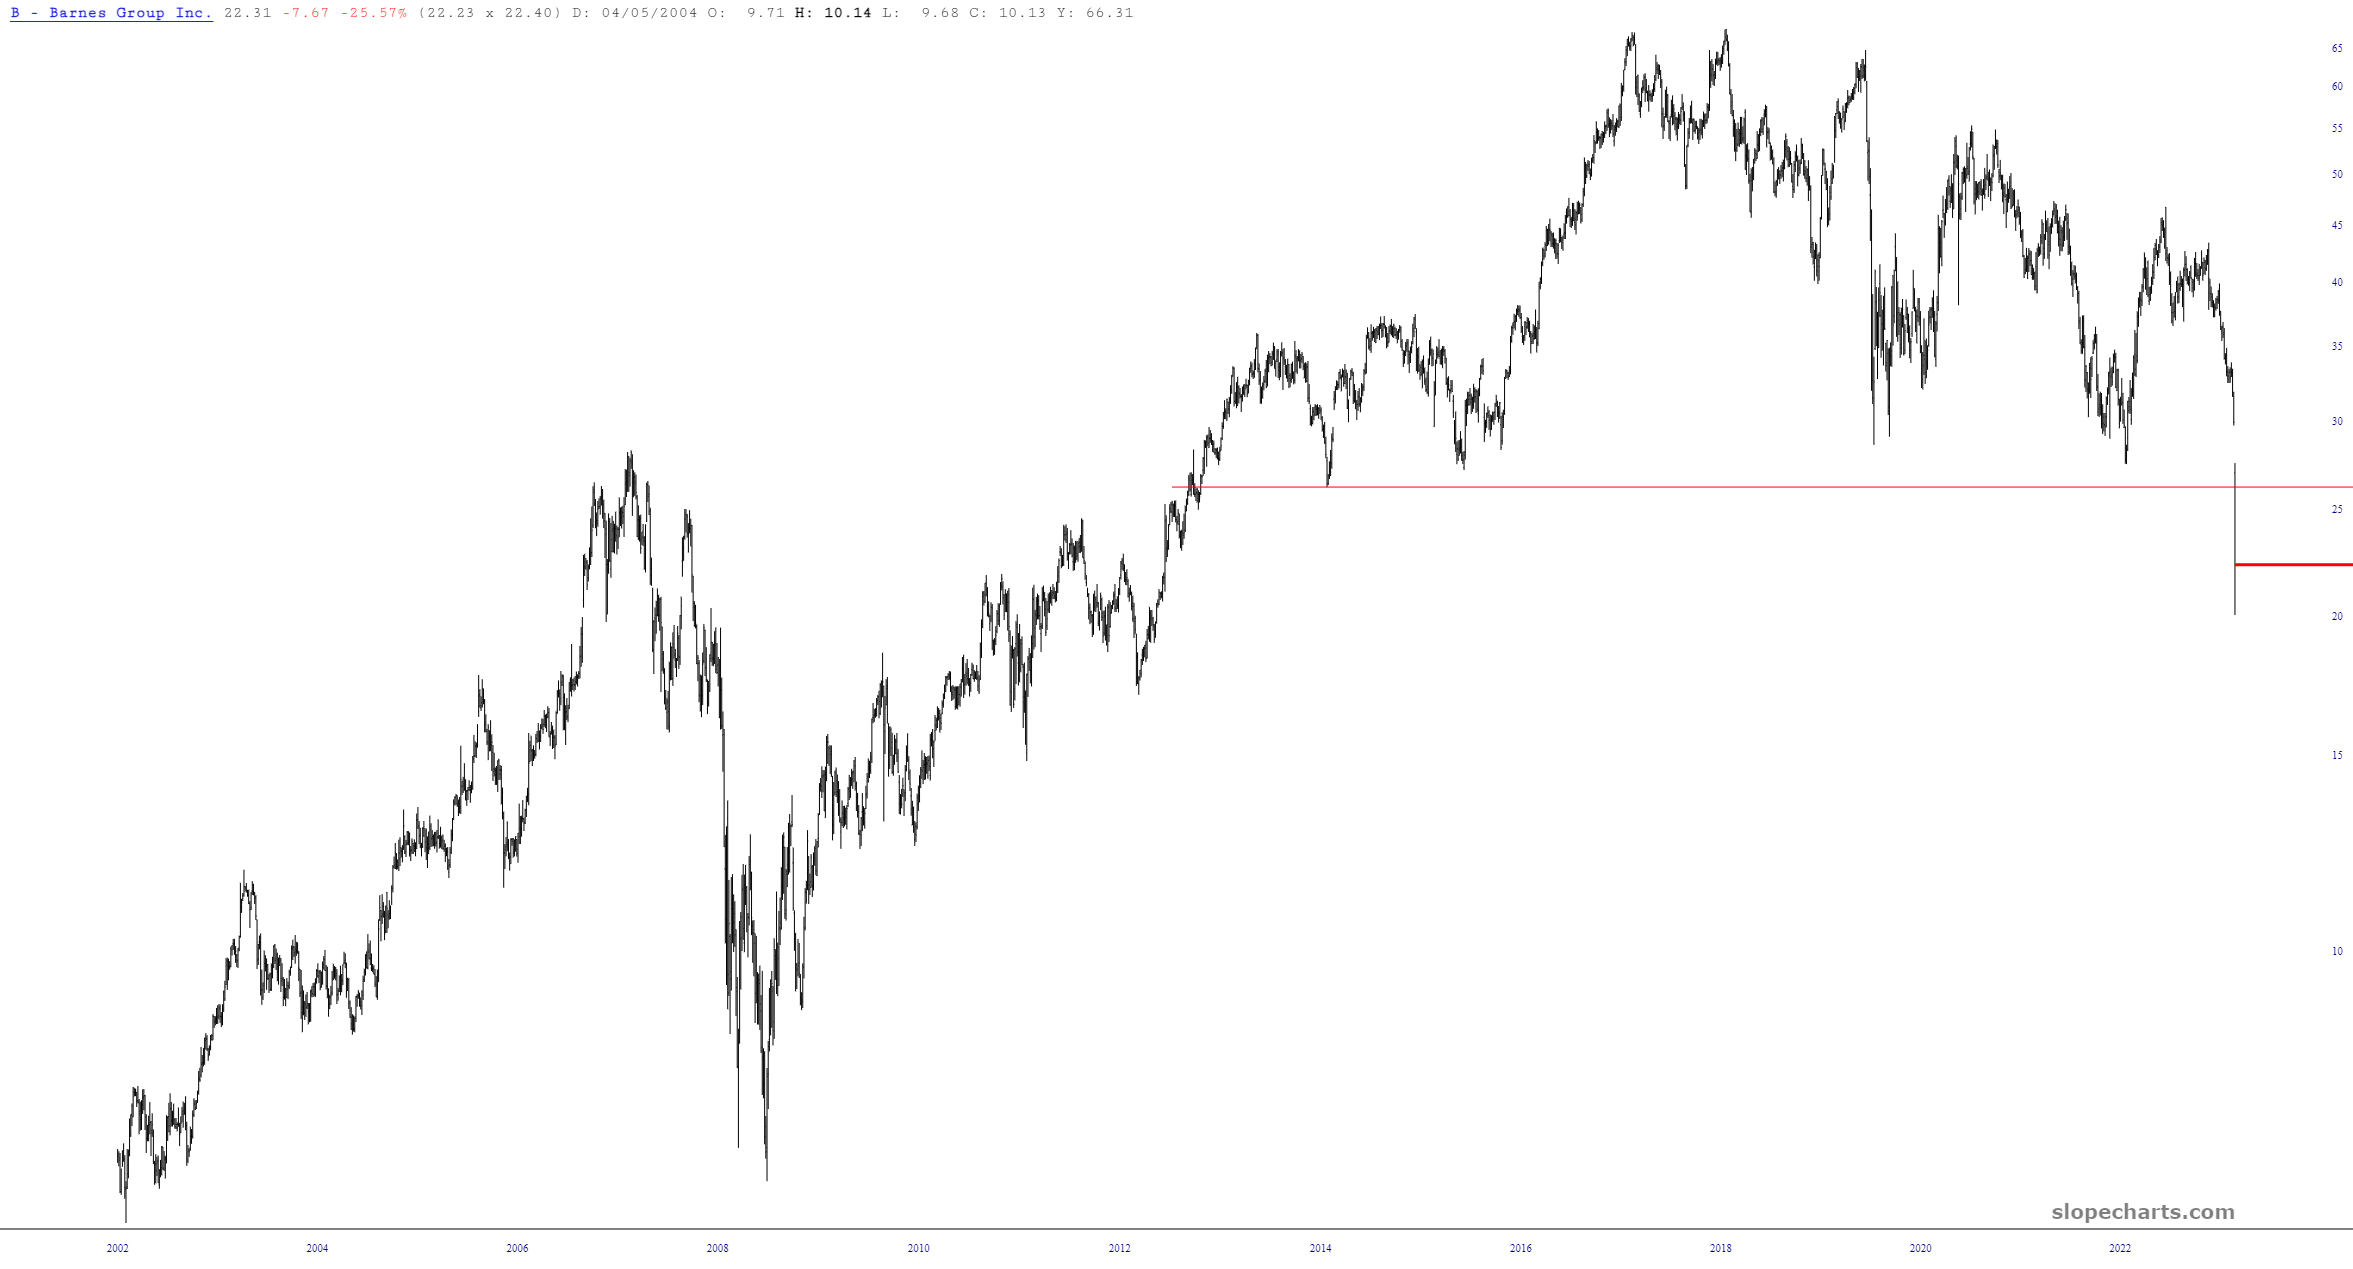
We have used this daily chart of the gold stock ETF, GDX in written and video updates to keep NFTRH subscribers apprised of the progress of the bounce from the early October low (after previously using the chart to manage the long correction that began with the May double top).
Let’s update the daily technical situation by noting that the GDX rally has halted where it should have halted, as we’ve expected resistance at or below the 200 day moving average (30.49) and/or clear visual resistance at 30. The pullback is in progress and has done a good thing by filling the upper gap as it grinds and tests the 50 day moving average. All normal.
(more…)