

Another One Laps The Market
In a post last week (“From The Viewpoint Of Calamity“), we mentioned that one of our hedged portfolios from mid-November more than doubled the performance of the SPDR S&P 500 Trust ETF (SPY) over the next six months.

In that post, we joked that despite those extraordinary returns, many readers would be indifferent.
We may have spoken too soon. Since then, we’ve seen a spike in interest, particularly after the following week’s portfolio (the one from Thanksgiving week last year) also more than doubled the performance of the market. We’ve also gotten some specific questions about why this is happening, which we’ll attempt to answer here. First let’s look at that Thanksgiving Week portfolio.
Our Thanksgiving Week Portfolio
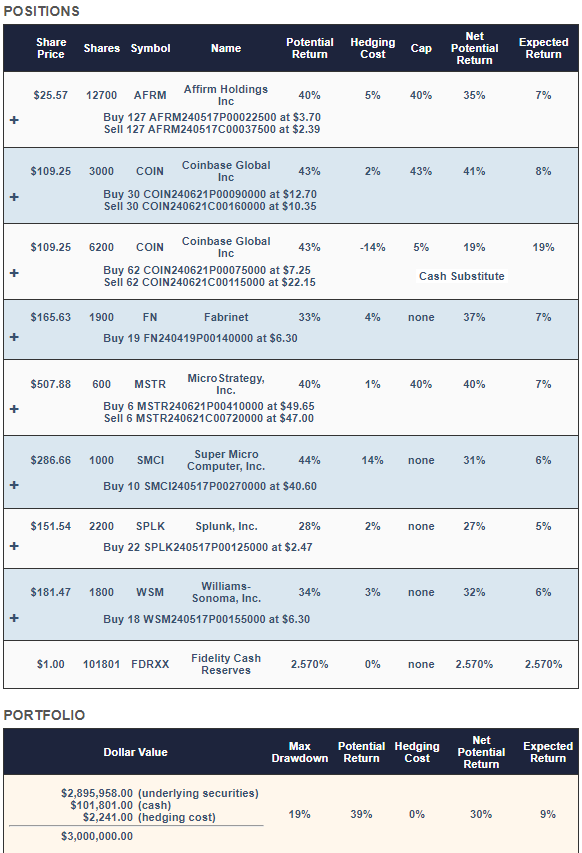
The underlying securities in this portfolio were the names our system estimated had the highest potential returns, net of hedging costs, over the next six months: Affirm Holdings, Inc. (AFRM), Coinbase Global, Inc. (COIN), Fabrinet (FN), MicroStrategy, Inc. (MSTR), Super Micro Computer, Inc. (SMCI), Splunk, Inc. [which was later acquired by Cisco Systems, Inc. (CSCO)], and Williams Sonoma, Inc. (WSM).
How That Portfolio Did
Over the next six months, our hedged portfolio returned +41.53%, net of hedging and trading costs, versus +16.06% for SPY.
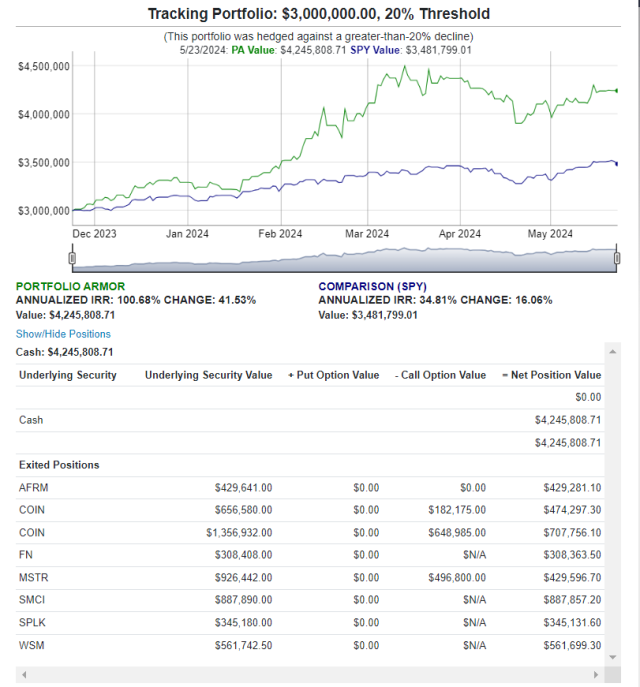
You can find an interactive version of the chart above here.
What’s Behind This Outperformance
This outperformance appears to be the result of two specific elements of our system. The first is a new factor we added to our security selection method about two years ago, described in this Twitter thread at the time.
In short, our new security selection looks for potential mean reversion over weekly, monthly and quarterly periods, and that’s enabled us to get better entries into volatile names.
The second element of our system driving this outperformance is an algorithm to determine when to hedge with optimal puts rather than optimal collars. It uses empirical data from our returns over the last seven years to decide when the greater potential upside makes the higher cost of hedging with uncapped puts worth it.
In the case of SMCI, for example, that algorithm determined it was best to pay 11% of position value to hedge with puts, in order to have uncapped upside. 11% sounds like it would be a huge drag on returns, but SMCI was up 195% over the next six months, so our hedging algorithm got that one right, and it paid off.
When Will This Outperformance End?
Probably when we have a major market rotation. At that point, it may take several weeks for our system to dial itself into the new market regime and start identifying likely winners again.
