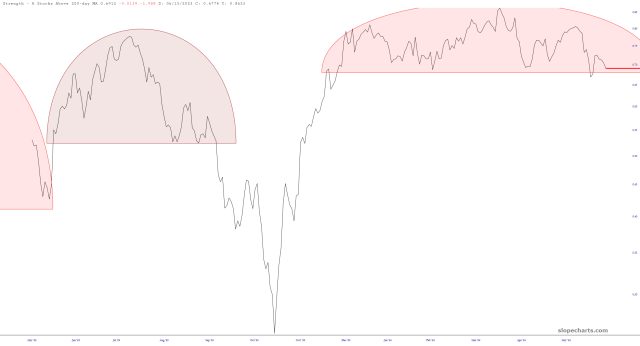
Below is symbol $SPX200MA which tracks the percentage of stocks above their 200-day moving average. As you can plainly see, this thing has been hammering out an enormous topping pattern since December.

Below is symbol $SPX200MA which tracks the percentage of stocks above their 200-day moving average. As you can plainly see, this thing has been hammering out an enormous topping pattern since December.
