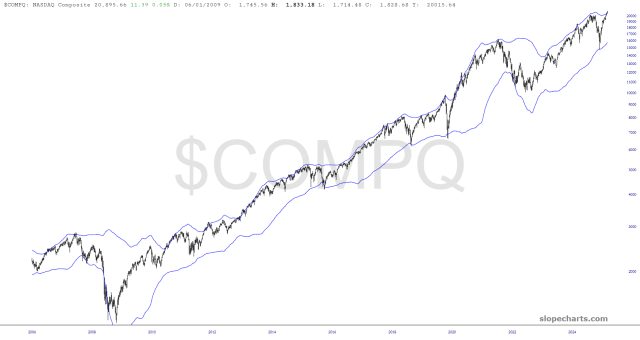
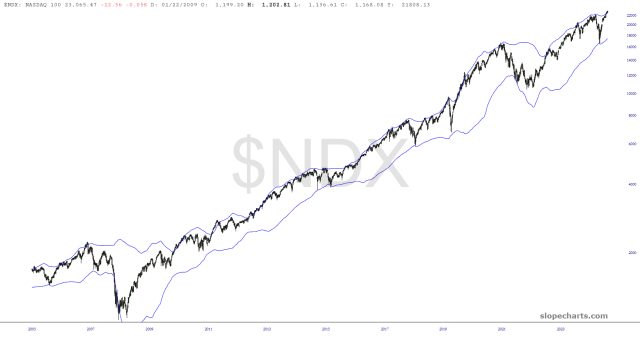
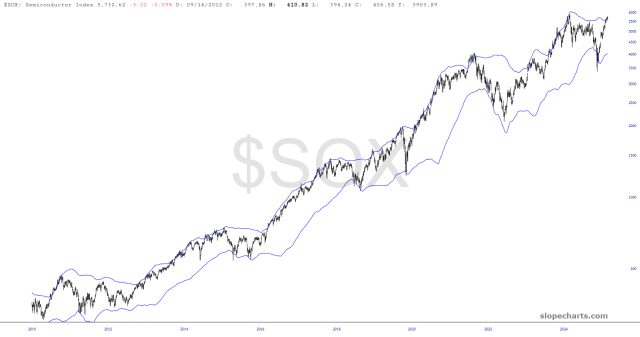
I don’t tend to use indicators much, but I was curious what the Bollinger Bands had to say about the big cash indexes. Here are three, and they’re all in the same configuration: wildly elevated prices are mashed up against the upper bands across the board.
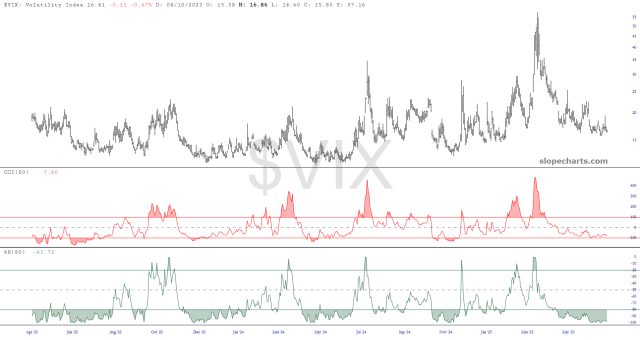
As for something which is apparently bottoming, I direct your attention to the volatility index and a couple of cyclic indicators. Looks bullish to me!