Slope initially began as a blog, so this is where most of the website’s content resides. Here we have tens of thousands of posts dating back over a decade. These are listed in reverse chronological order. Click on any category icon below to see posts tagged with that particular subject, or click on a word in the category cloud on the right side of the screen for more specific choices.
Let’s take a fresh look at the long-term ratio chart of XME/GDX. It illustrates how, over a period of decades, the relative value of these two metal-related ETFs tends to oscillate with some regularity. It seems to me that XME is presently heading for some serious weakness relative to GDX.
I’m pleased to report that the ENTIRETY of the “Trump pushed the tariff deadline out even FARTHER” rally has been destroyed. Good. Amongst my short positions, one that’s cruising along nicely is the wee-wee-hardening organization HIMS, which is down over 4% and whose stop-loss I’ve tightened up.
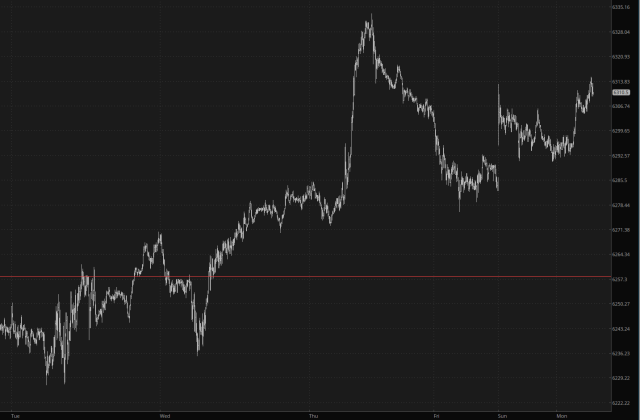
We all made it through another mandatory holiday, and a tremendous amount has happened during our forced three-day idleness. There was the horrible tragedy in Texas, created by 1.8 trillion gallons of water dumped from the heavens in a matter of hours, and the OBBB victory lap, as well as the evidently recently discredited news that Elon had formed the America party. Let’s catch up with a few pre-opening charts.
The ES, NQ, and RTY are all showing red numbers, but as I mentioned yesterday, it’s only because data providers are pretending Friday trading didn’t exist. We are in fact higher than Friday’s close, but net of Friday’s trading, yes, we are down a little. Meh. BFD.