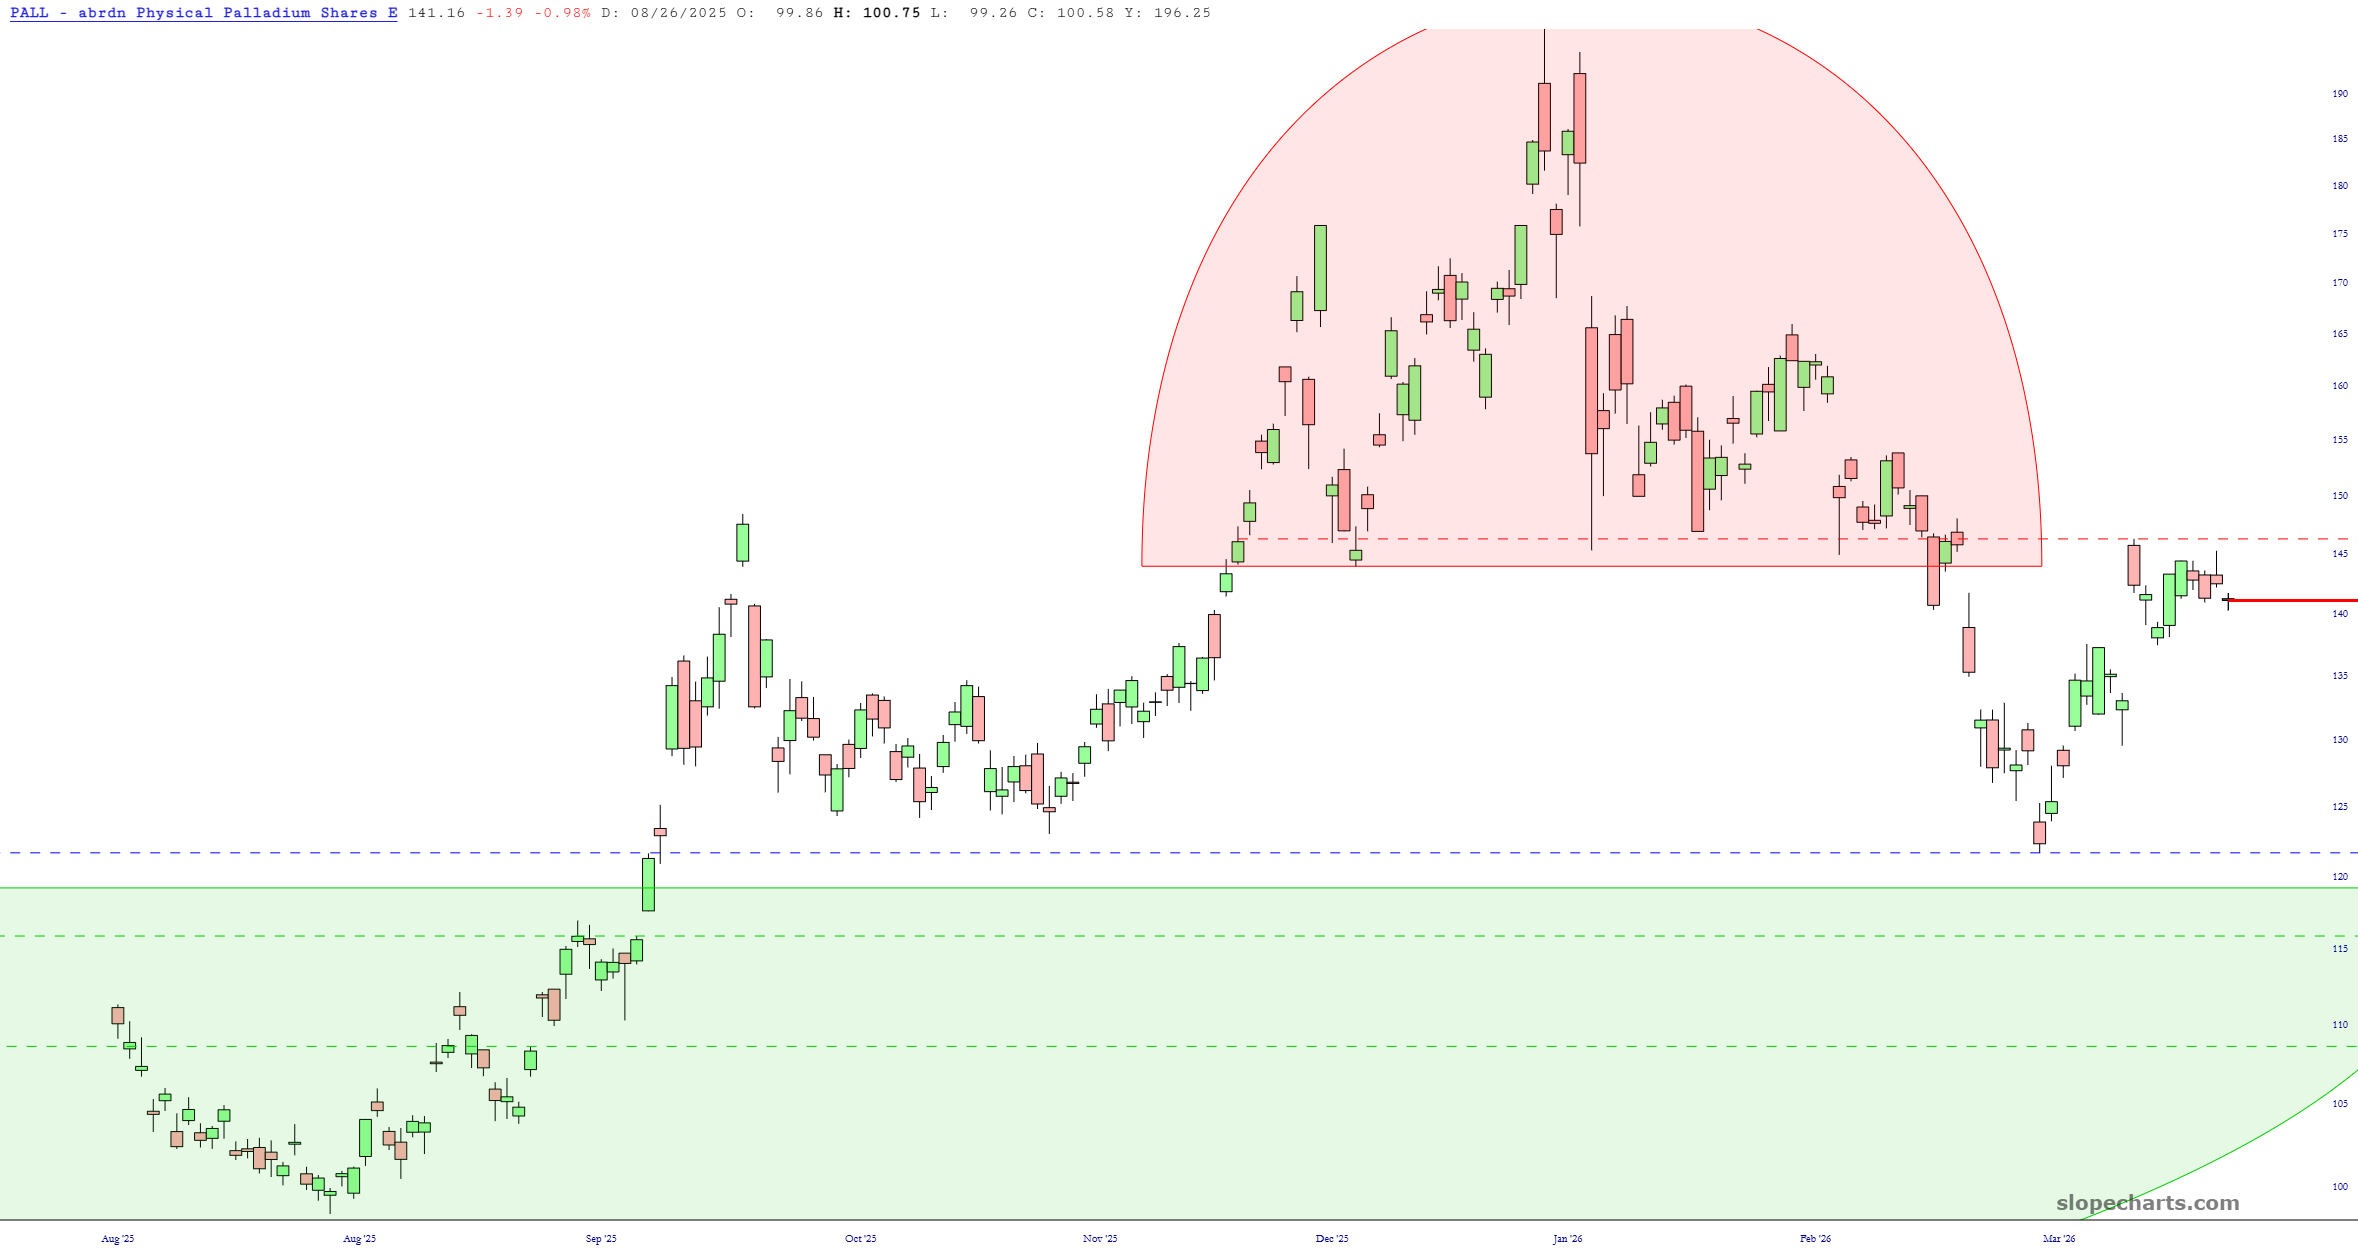
Remember how crazy I was about Platinum last year? I think this fella’s about to take a hard turn lower.
Slope initially began as a blog, so this is where most of the website’s content resides. Here we have tens of thousands of posts dating back over a decade. These are listed in reverse chronological order. Click on any category icon below to see posts tagged with that particular subject, or click on a word in the category cloud on the right side of the screen for more specific choices.
Remember how crazy I was about Platinum last year? I think this fella’s about to take a hard turn lower.
In my post on Tuesday 31st March I was saying that the likely best thing that could happen in the Iran War was that the US declares victory and that the war has ended regardless of any input from Iran. This would avoid further escalation and the major economic shock to the world economy that would likely result from longer term disruption to the Strait of Hormuz and likely also the Bab El-Mandeb Strait.
In my post on Wednesday 8th April after Trump declared a ceasefire and accepted talks on the basis of Iran’s ten point plan I posted charts showing bottoming patterns on SPX, QQQ, DIA and IWM that had broken up and those all made their targets last week, with new all time highs on SPX, QQQ and IWM on the back of a ceasefire in Lebanon and numerous statements last week suggesting that a peace deal was close.
(more…)Hey, I guess I should be grateful everything isn’t raging green to new highs, right? Not yet at least.
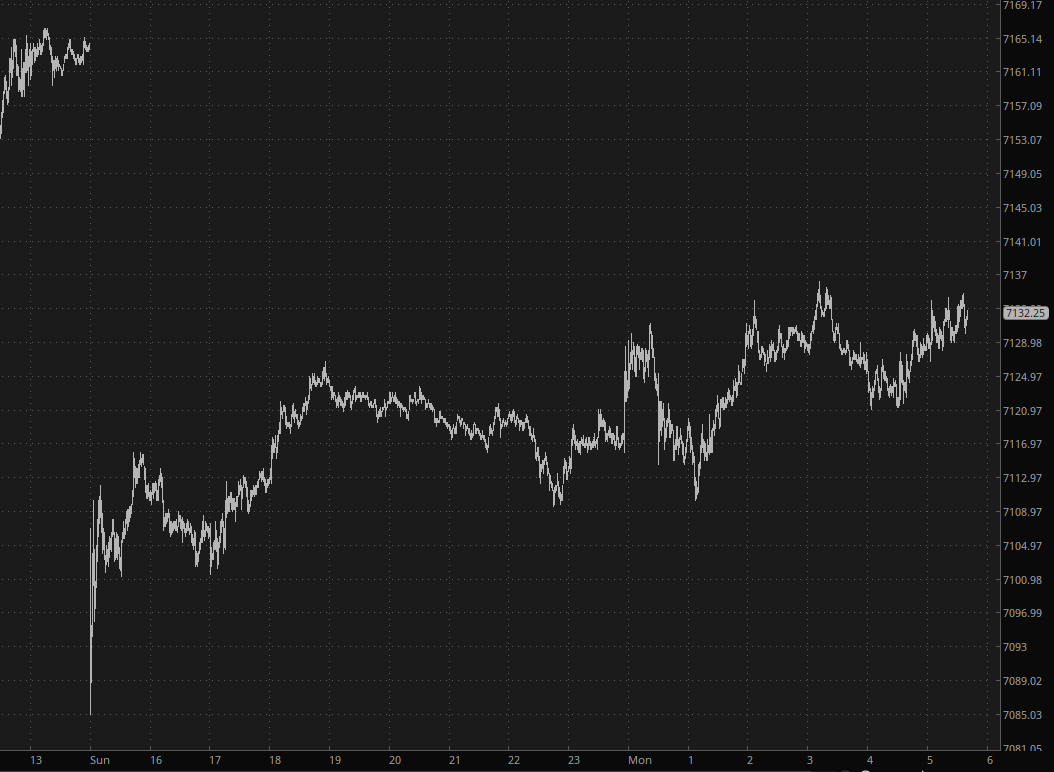
In the least surprising event since someone released a hammer and it fell to the ground, equity futures erased the majority of their Sunday shock drop. On the heels of the mega-rally of the past few weeks, the news over the weekend would normally have crashed equities, but as I stand here before the opening bell, futures are down about half a percent or so. The universal ticker symbol is now BFD.
I have learned through hard experience not to get excited about Sunday night futures action. Time and again, it looked like Monday was going to be absolutely dynamite, and yet it would always turn out to be an agonizing disappointment. On that cheerful note, let me not waste time cheering on the red quotes on the screen in front of me this evening and simply share three videos from this weekend at our mountain home with my beloved pack.
Too many of the ETFs right now can only conjure up the reaction, “Wow, that’s just nuts. I wonder if it’ll ever stop going up, or what?” That’s a silly waste of time, so what I’d like to do instead is focus on the charts which, even given recent circumstances, still presenting exciting and intriguing risk/reward ratios.
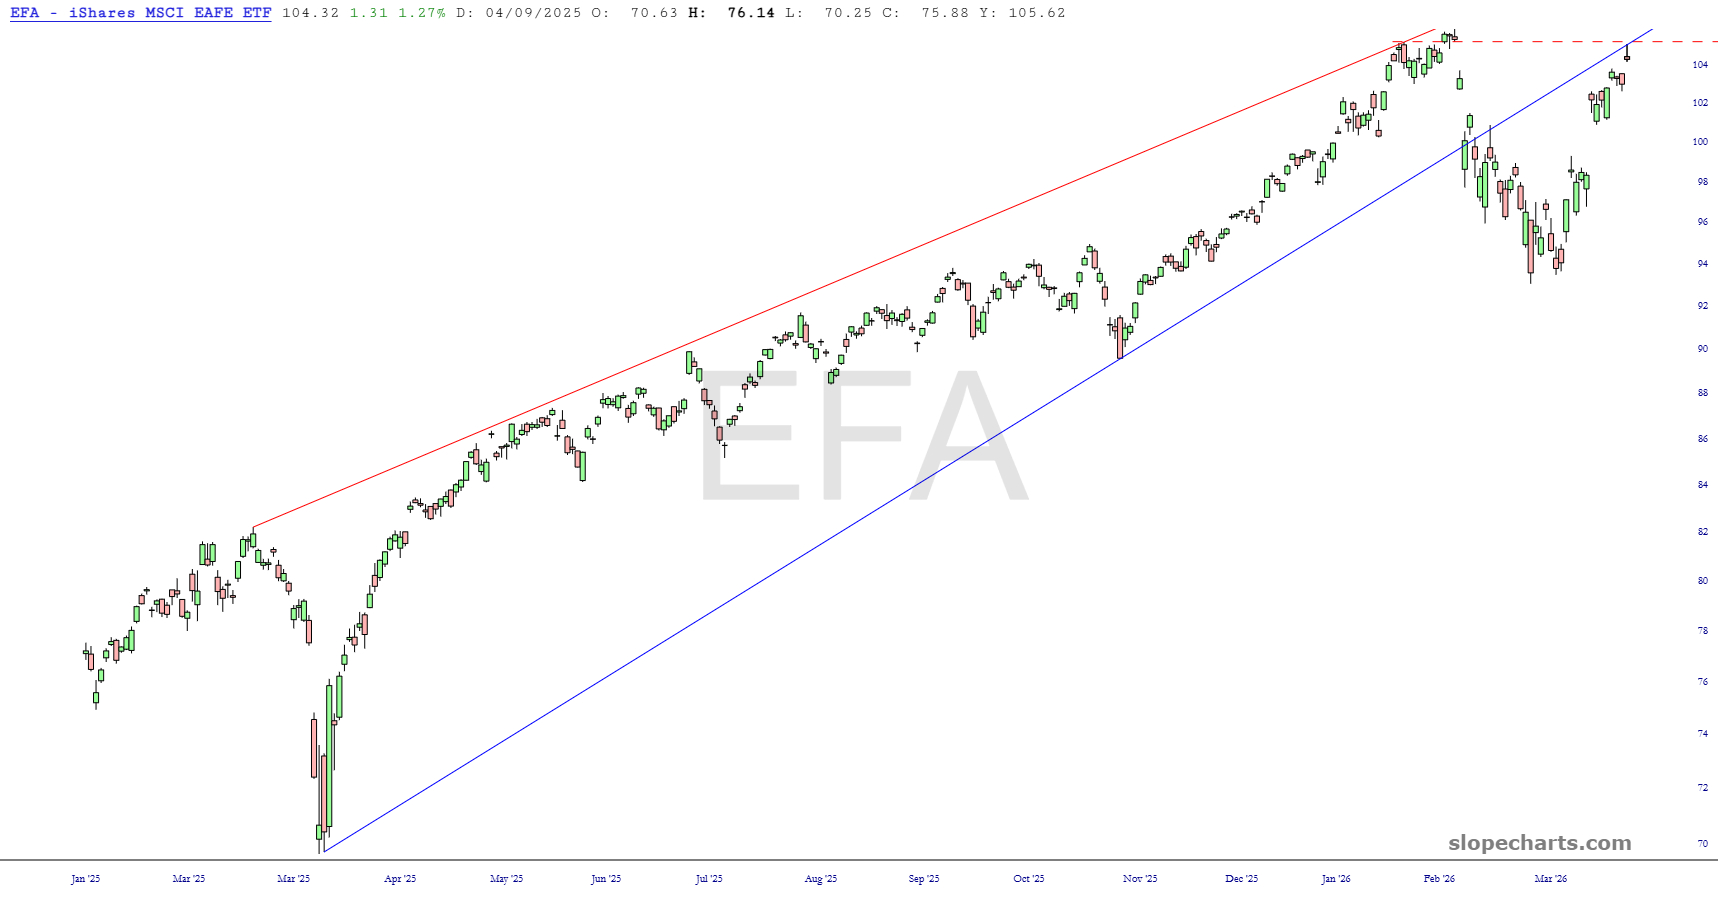
First up is EFA, which I am short. There are three exceptionally cool things about this chart. First, Friday’s action formed a beautiful shooting star reversal pattern. Second, the price peak on Friday was precisely below the broken trendline. Third, the price peak also came deliciously close to an important price gap. This is just a dynamite combination.