
On this day an awfully long time ago a roman general turned dictator for life learned the importance of maintaining a decent personal security team in a tyranny. It hasn't tended to be a particularly eventful day since then though there are strong rumblings on USD and CL today which I'll be coming to later.
SPX pushed up strongly yesterday and closed 6 points below the daily upper bollinger band. Historically this signals that the unusually short retracement from the upper bollinger band has ended. SPX is reaching 70 on RSI again so we are in an area where the next big high may start to form, but that could take a while and go quite a bit higher:

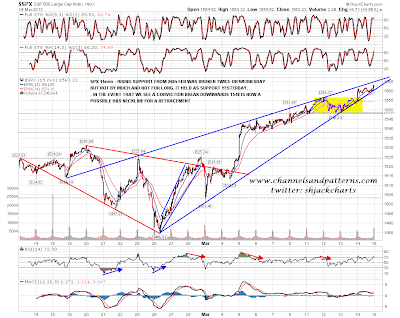
On the SPX 60min chart rising channel resistance is now in the 1576 area, at the 2007 high. I am expecting a test of that high before too long and that would be a candidate area to see a strong retracement, albeit most likely not the next major high itself unless a double-top were to form there. There is possible negative divergence here on the 60min RSI, but that would only crystallize on a break below yesterday's low, in which case the obvious target would be the possible H&S neckline in the 1548 area:

There is a frail looking wisp of short term hope for the bears here on the SPX 15min chart, where the rising wedge I've been watching is still in play and a currently very theoretical short term H&S may be forming. We would have to see a conviction break below wedge support in the 1560 area however, and it's worth mentioning that rising wedges break up about 30% of the time, and the target on a break up of this wedge would be in the 1645 area, though that wouldn't be a high probability target:
Looking elsewhere this morning I'm not seeing much else to cheer the bears here. AAPL is again testing falling wedge resistance and this is a very bullish looking setup on a break up. If AAPL did break up here that could give a significant extra boost to equities of course:

I've been watching a strongly bullish setup form on CL all week and that's looking very strong this morning. A rising channel has now formed on CL and while that holds this defines and supports the current uptrend. The possible H&S that I've been following as it formed this week is now fully formed and has broken up. The target is in the 97.5 area, effectively for a test of the Jan/Feb highs. This is a very strong setup and unless we see the rising channel break on CL I am assuming considerably more upside:

I've been posting the DX chart quite a bit recently, looking at the negative RSI divergence there that has been warning of retracement soon. That retracement has now started and DX is testing the short term rising support trendline which is first support. If that breaks there are strong support levels at 92 and 91.5. Those are both also possible H&S necklines. A strong and sustained break below 91.5 wouldn't kill the larger bullish double-bottom setup here on DX but it would throw it into some doubt:

Trendline support on SPX is in the 1560 area and the 50 hour moving average on ES is in the 1558.5 area. On a break below both the bear side here would start to look potentially interesting but the current moves on CL and DX will tend to support equities here.
