
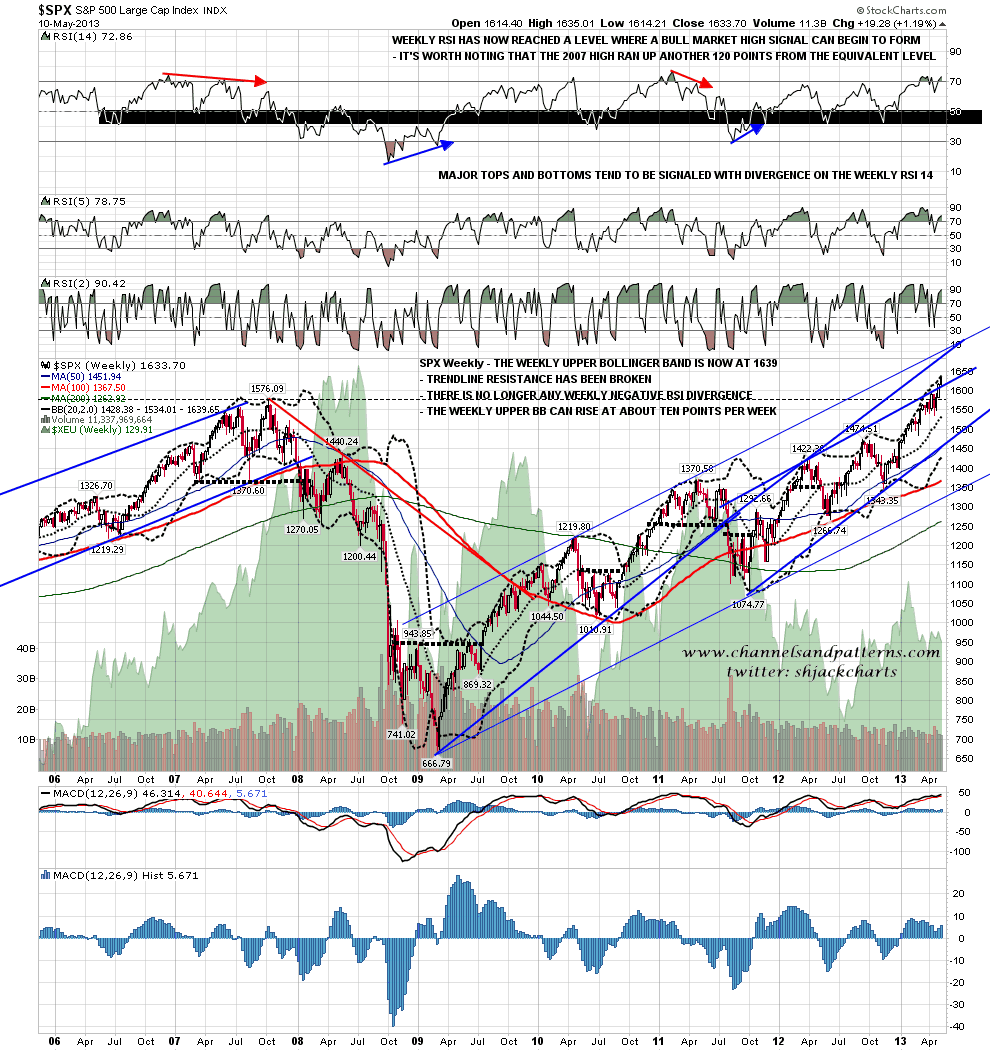
SPX recovered to test the highs on Friday and closed six points below the weekly upper bollinger band at 1639. It’s very rare to see a significant break above the weekly upper bollinger band, and that can only rise at about ten points per week, so we are unlikely to see any powerful further drives up without some consolidation or retracement first. Any immediate weekly rises from this level will be incremental:
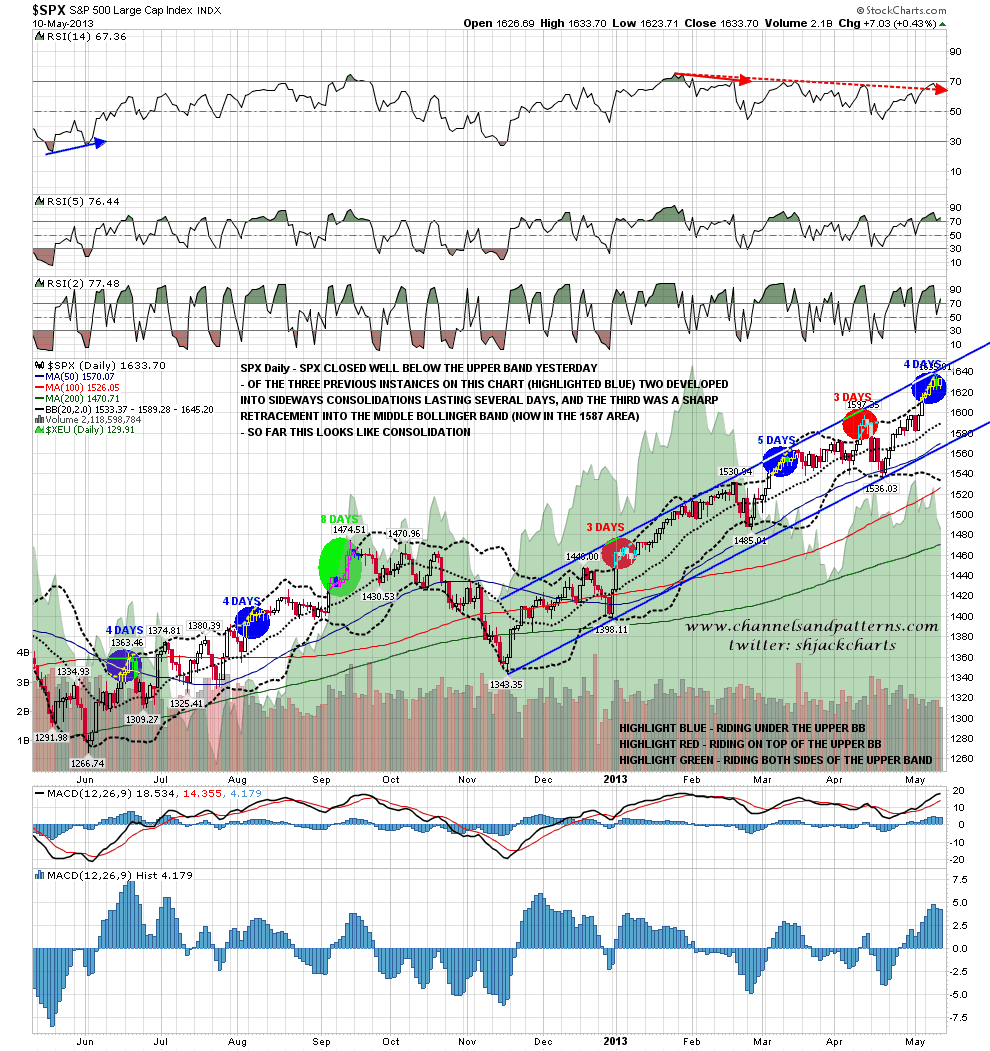
On the SPX daily chart I was saying on Friday morning that a pull away from the daily upper bollinger band like the one on Thursday generally signals consolidation or retracement. So far we are seeing consolidation:
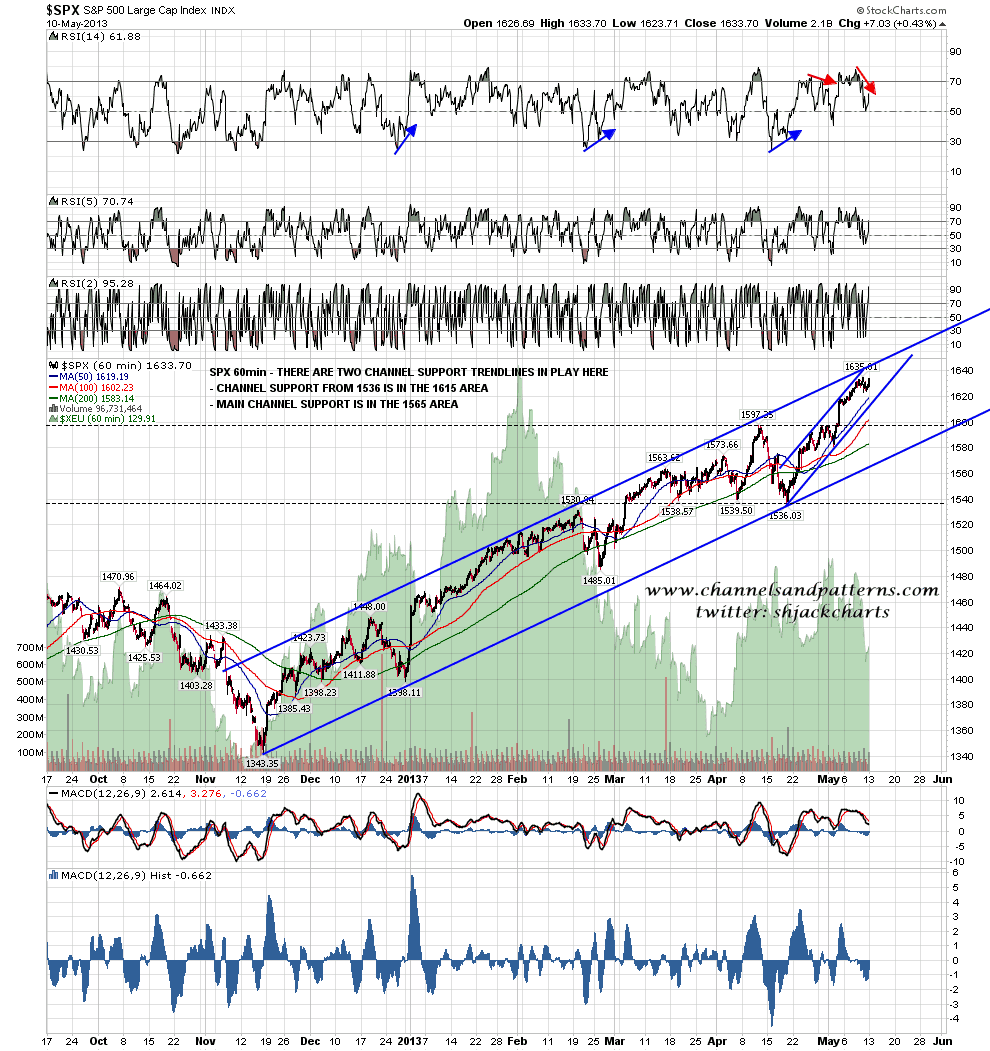
On the SPX 60min chart the important support levels are the channel support trendline in the 1615 area, and main channel support in the 1565 area. Main rising channel resistance is now in the 1645 area and that is within the range for consolidation here, so it is both a target and strong resistance:
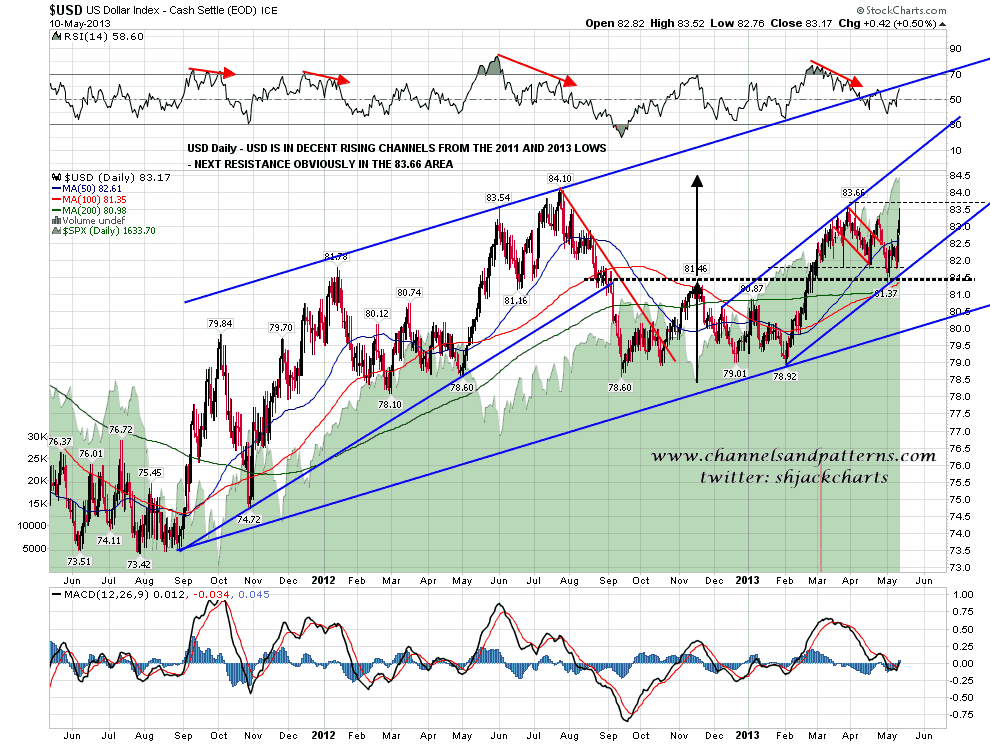
I need to do a couple of dedicated weekend posts on USD and bonds, and I am planning to do those soon. In the interim though I’d like to explain how I am seeing the current positions on both in the context of the long term charts. Firstly on USD I have rising channels from the 2011 and 2013 lows. There’s a possibility that USD is making the second high of a double-top here, but unless we see USD break down below 81.37, I am treating this as a strong uptrend. Here’s how that looks on the daily chart:
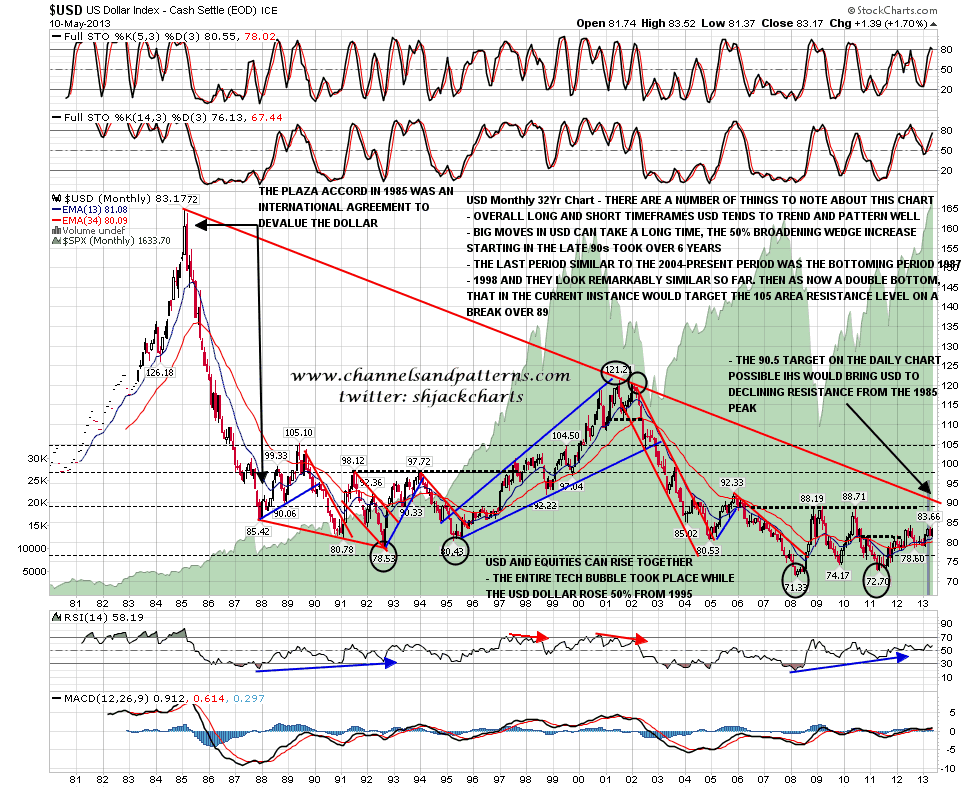
On my longer term USD chart from 1980, I am very strongly considering the possibility that the 2011 low was the second bottom of a double-bottom in a setup similar to the 1992-5 double-bottom. The next obvious target is a test of strong resistance in the 88/9 area, followed shortly by a test of declining resistance from the 1985 high in the 89.5 to 90.5 area. On a break over that the double-bottom target would be at the established 105 resistance level. This is a chart I am watching with great interest as it has huge implications:
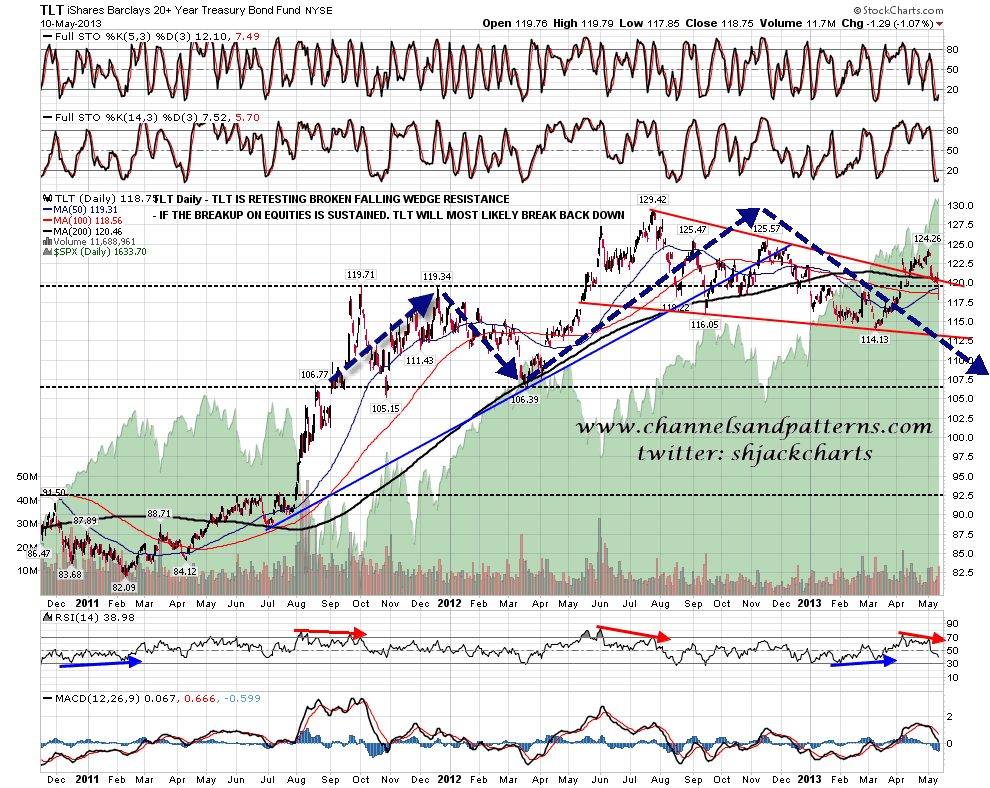
A couple of readers have been confused by my take on bonds recently, so I’ll put that in the context of the long term chart again. What I have been looking for on TLT is either a break up to the 129/30 to make the second high of a double-top, or a break down to complete the head on a longer term H&S pattern. On both views the longer term take is bearish for bonds:
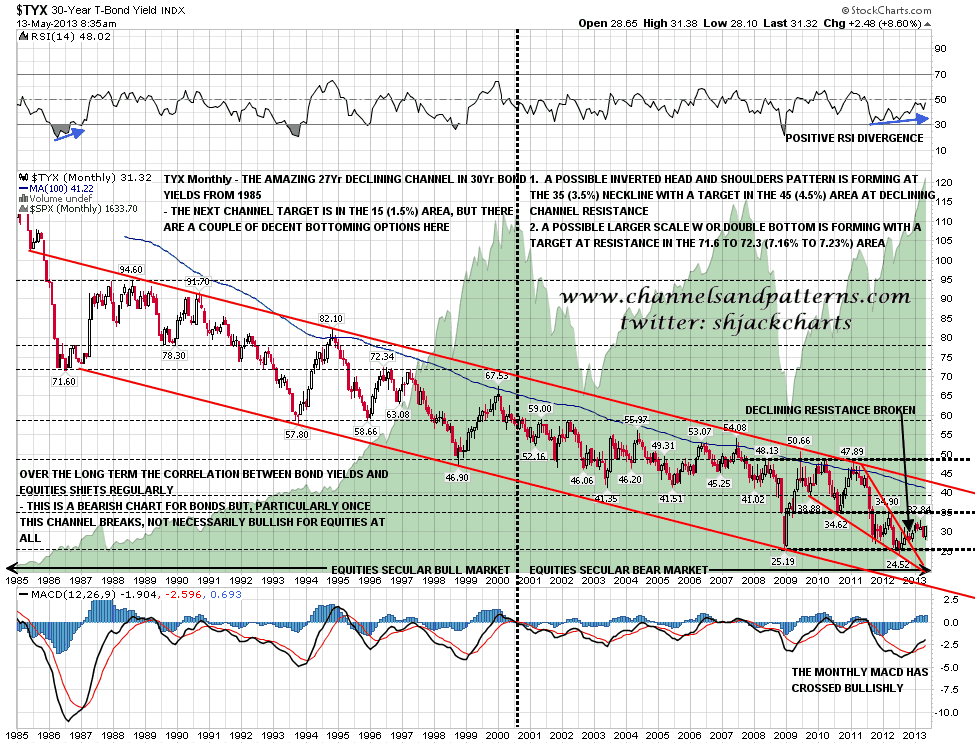
On my long term TYX chart from 1980 (30yr bond yields), my take on this inverted view of bonds is that bond yields most likely made the second low of a double-bottom in 2012, and may well be forming a shorter term IHS for that reversal. This IHS is the direct inverted analog of that possible H&S forming on TLT. This view on bonds is backed up by the three year falling wedge that broke up last year:
I’m expecting a two way market on SPX/ES in the next couple of weeks, though as I noted on SPX, the top of that consolidation range may well be in the 1645 area. Overhead resistance here is close by and strong, so the safest looking trade on equities here is to scalp short on any strong spikes upward.
