As we continue to frantically work in the Slope Labs to finish the alpha version of our latest product, I offer you some updated market charts with some words about each of them in the caption. As a general note about my own trading, I have pushed my commitment level to just above 100% spread among 50 roughly equally-sized short positions. Anyway, here are the charts, any one of which can be made jumbo-size with a click.
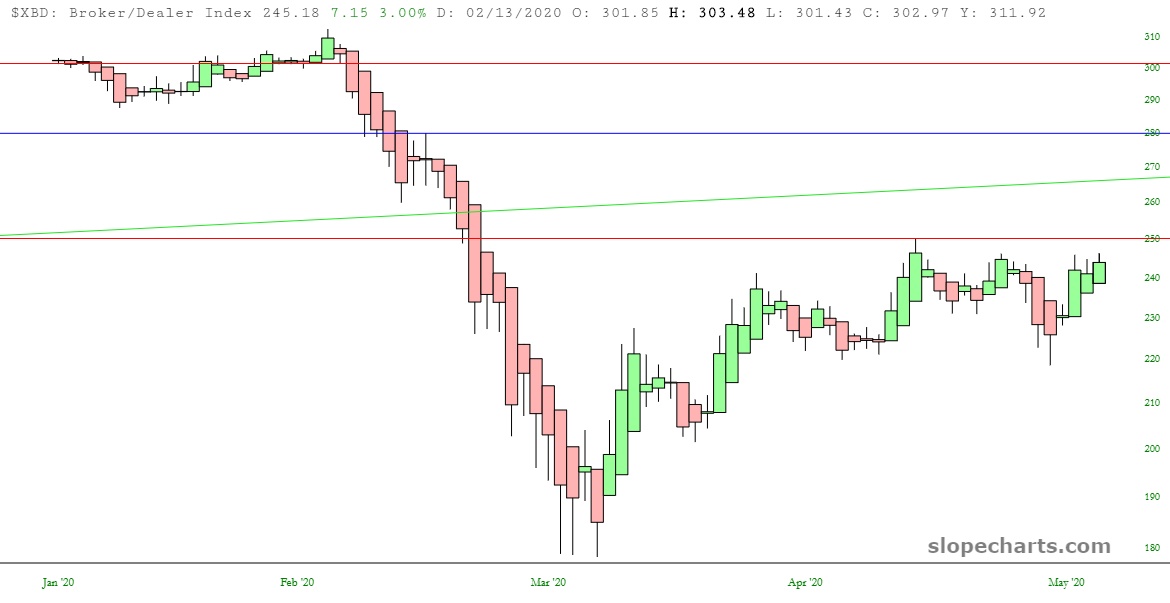
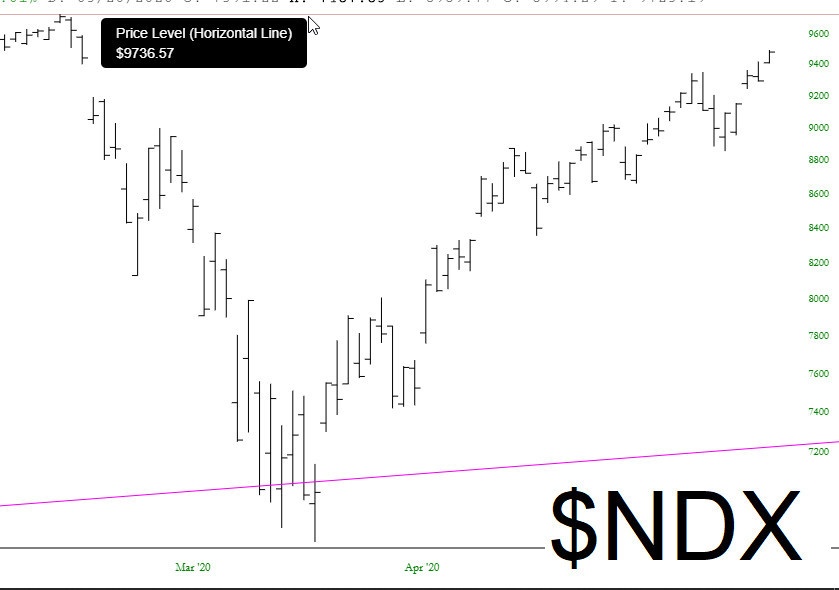
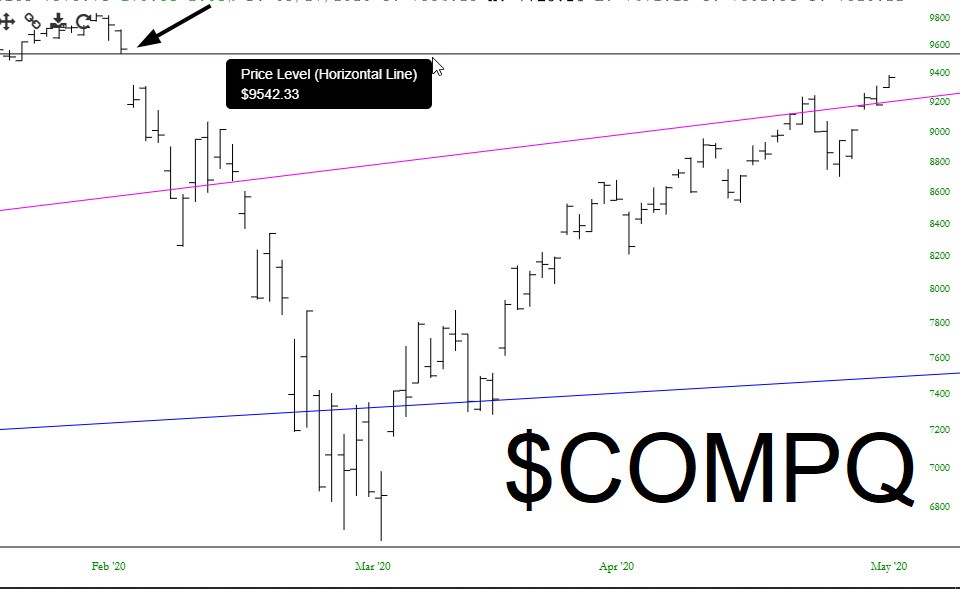
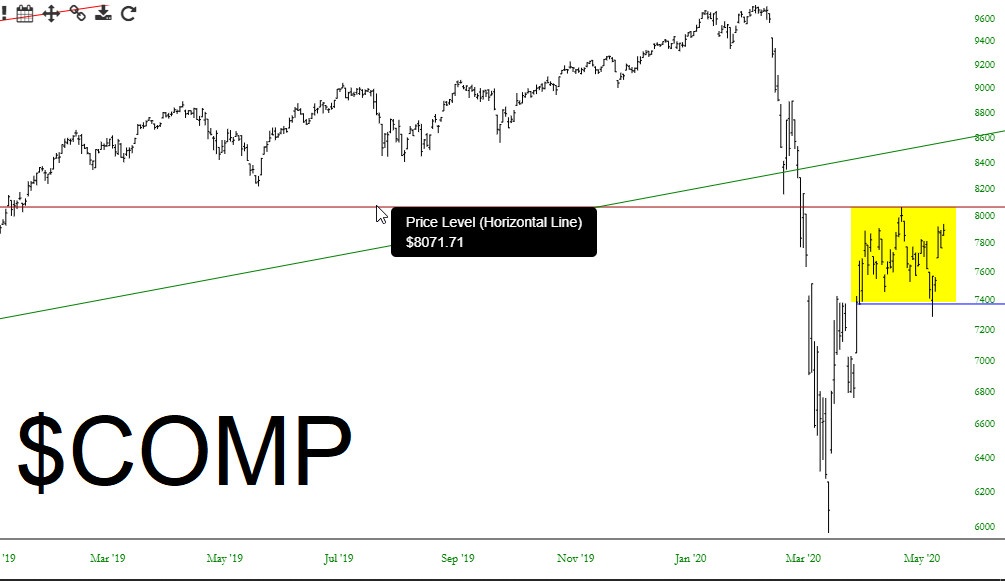
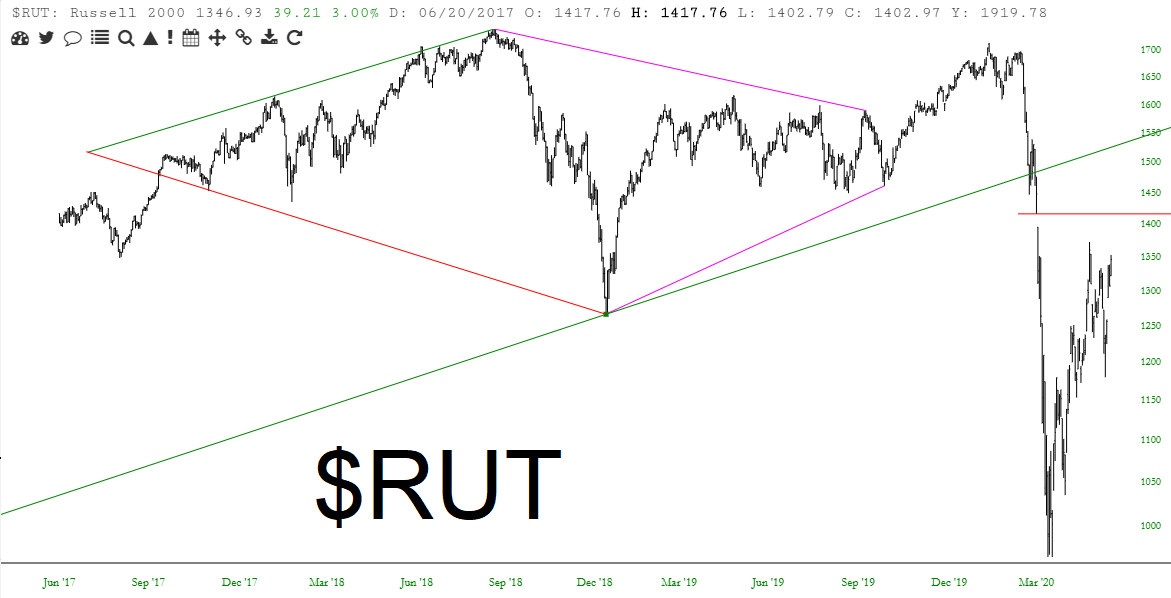
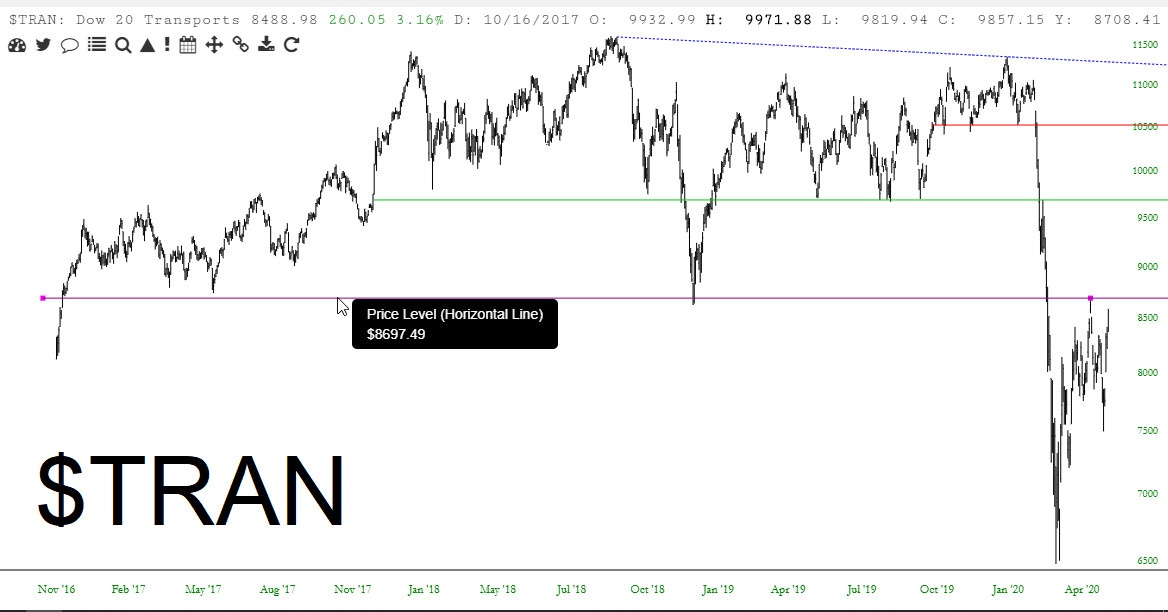
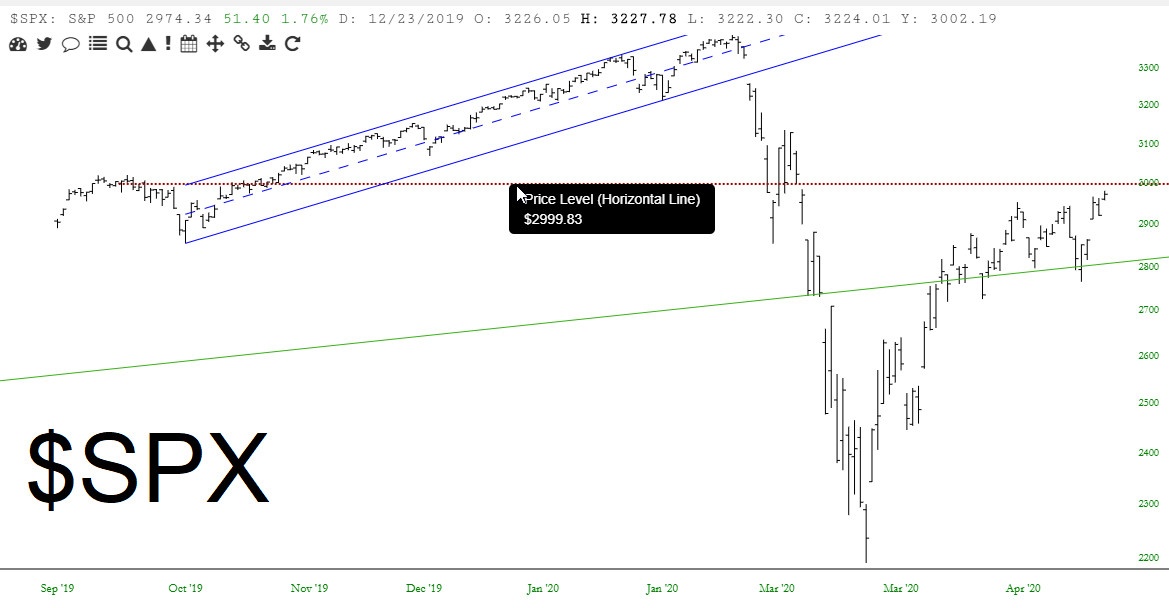
The VIX has had the life choked out of it, falling from almost 90 to the mid-20s. There is a price gap at 18.12, although God forbid we actually make it down that far.Hats off to TNRev, as gold miners continue to thrive. The $HUI has pushed to the highest level seen in many a year.The broker/dealer index had a steady downtrend (made more clearly visible with our new H-A chart style) and continues to stall out beneath that red resistance level.The NASDAQ 100 has never heard of Covid in its life. It has closed all its price gaps and is very close to its highest point in the history of the universe.The NASDAQ Composite has yet to close its own price gap, whose level is noted here and highlighted with an arrow.Last Thursday morning, it looked liked all holy hell was going to break loose with the Dow Composite. One interview with Powell on 60 Minutes has cured everything. We remain range-bound.Small caps, represented by the Russell 2000, are a tough read. They have been overall much weaker than other indexes, although they could still keep pushing to at least the price gap where I’ve placed the red horizontal line.The oil index continues to float just beneath its huge price gap.The Dow Transportation Index is much worse off than the Industrials, with a massive mountain range of overhead supply suppressing prices.Finally, the S&P 500 has not sealed its price gap, although even a very tiny “up” day would cure that.