
I don’t hear many people talk about the Dark Pools Index, but here is a quick introduction. If I am understanding it fully, and that is a big IF, it is an attempt by a market researcher (who can be found on twitter under the handle @Squeezemetrics) to hazard a guess at the buying and selling demand being processed by market makers. I’m sure I cannot explain it fully and you would be better off reading the white paper at squeezemetrics.com. It is a quick five minute read and very interesting. All data is freely downloadable to play with as you please.
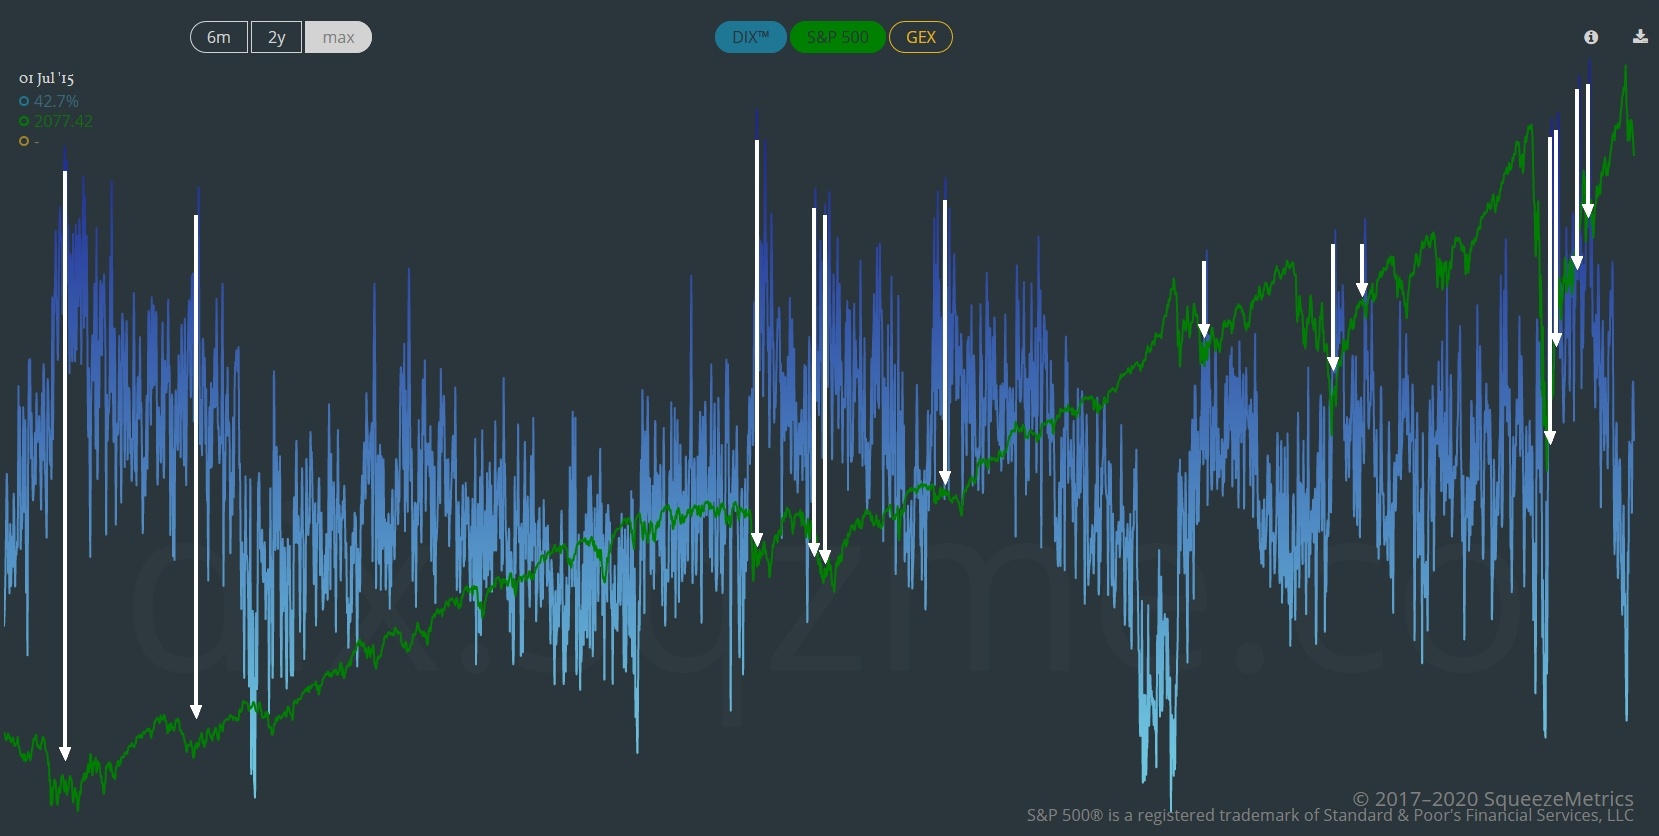
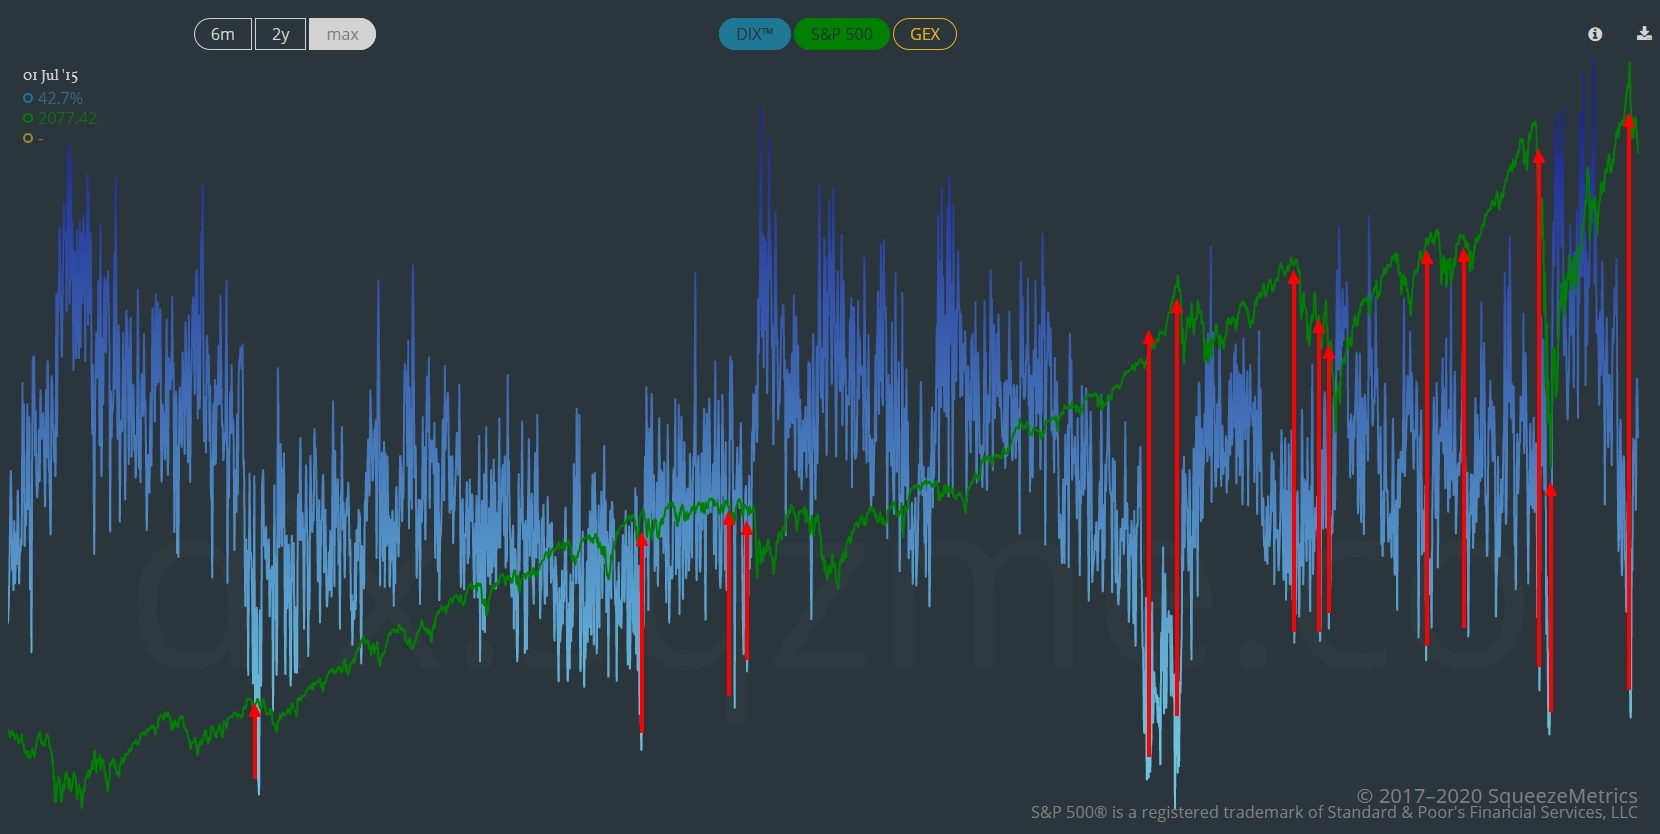
Generally speaking, when the DIX (Dark Pool Index) moves to the upper extremes, dark pool buying is a primary influence. When the DIX moves to the lower extremes, dark pool selling is the the primary influence. See for yourself.
I know there are signal parameters described in the SqueezeMetrics twitter feed and you can feel free to look for them there. Of course, you are free to discover and make your own signals as well, just as I did.
Below is my own variation on the DIX data. I applied 2-Standard Deviation bands around a 100-day SMA looking for extreme crossovers. It’s not perfect and I think needs to be taken into context with market structure and breadth readings. One valuable signal is when buy or sell signals cluster over a short period of time. It has a good tendency to mark major turning points.
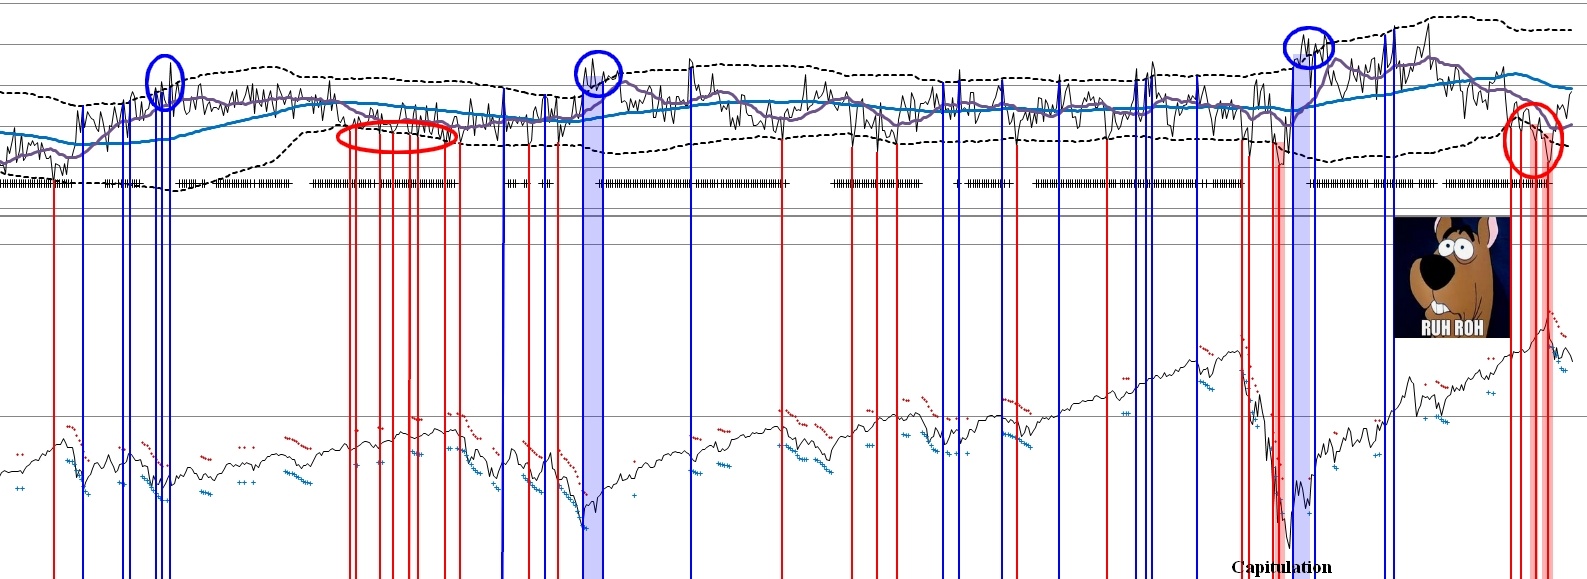
If history repeats, the bears are back in town.
