
A string of important support trendlines on equities were hit at the lows yesterday. On SPX the support trendline from the Dec 19 low was tested. That may be the lower trendline of a rising wedge but the upper trendline lacks a third touch to confirm it:

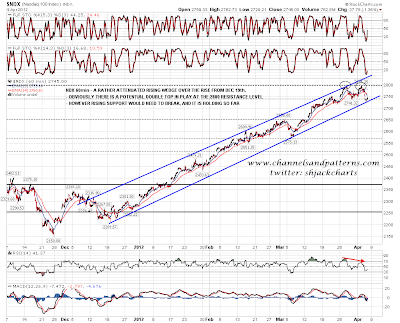
On NDX there is a definite though rather attenuated rising wedge and that hit support from Dec 19 too:
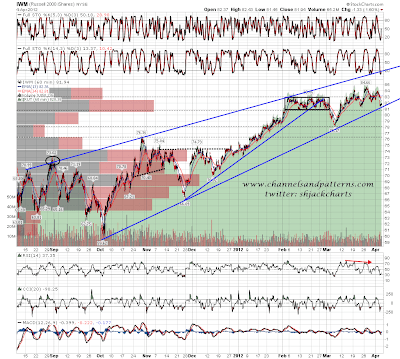
On RUT, using IWM as a proxy here, there is a fairly definite rising wedge and that hit rising support from the October low:
Now these trendlines all need to break in trading hours to look immediately bearish, and it looks as though equities may gap down through them, which really would look bearish. We'll have to wait for the open to know however. On ES the rising support trendline from Dec 19 broke down yesterday, which was bearish, but the trendline was unconfirmed by a third touch. The break was then retested at yesterday's close and that confirms the trendline and looks distinctly bearish.
Other things to note on this ES chart are the little H&S target in the 1380 area, not marked here but I posted it yesterday, and the double-top target in the 1353 area on a conviction break of 1386. There is also positive divergence on the ES 60min chart IF ES reverses back up here:

ZB reached declining resistance overnight and a break above would look bullish. In the meantime this is the obvious level to reverse down of course:

EURUSD has almost reached the neckline for the H&S I posted yesterday. That neckline is in the 1.303 area and is also trendline support. On a break below then a move to 1.30 would deliver a lower low, and below that the H&S target is in the 1.253 area:

Lastly a chart on precious metals. Gold and silver are testing important support levels but a look at GDX suggests that they will break and go lower. GDX broke below a declining support trendline from 2010 yesterday and as I posted a couple of weeks ago that trendline was also the neckline on a large H&S. The precious metals complex is looking lower:

I'll be watching the support trendlines on SPX, NDX and RUT at the open today, and if they break down I'll be leaning very bearish. The obvious targets on SPX are in the 1370 and 1340 areas. If SPX can reach 1340, and reverses there, that would complete the neckline on a potential H&S indicating into the 1260 area. If that were to form we would then see a multi-week bounce into the 1370-90 area before falling further.
