I know it’s impossible to believe – – absolutely impossible – – but there will be a bear market in equities one day. There will come a time, I promise you, when people will recall the “Stonks Only Go Up” phrase on everyone’s lips these days and laugh at how foolish everyone was. But whether the bear market begins on Monday or in ten years is anyone’s guess, because the Fed knows just how badly screwed they are if this charade ends. We’re talking end-of-the-road for the U.S. at that point.
The key is to keep an eye on even minor changes. Below are ten index charts and a few words about what’s require in each case for even a small breakdown to take place.
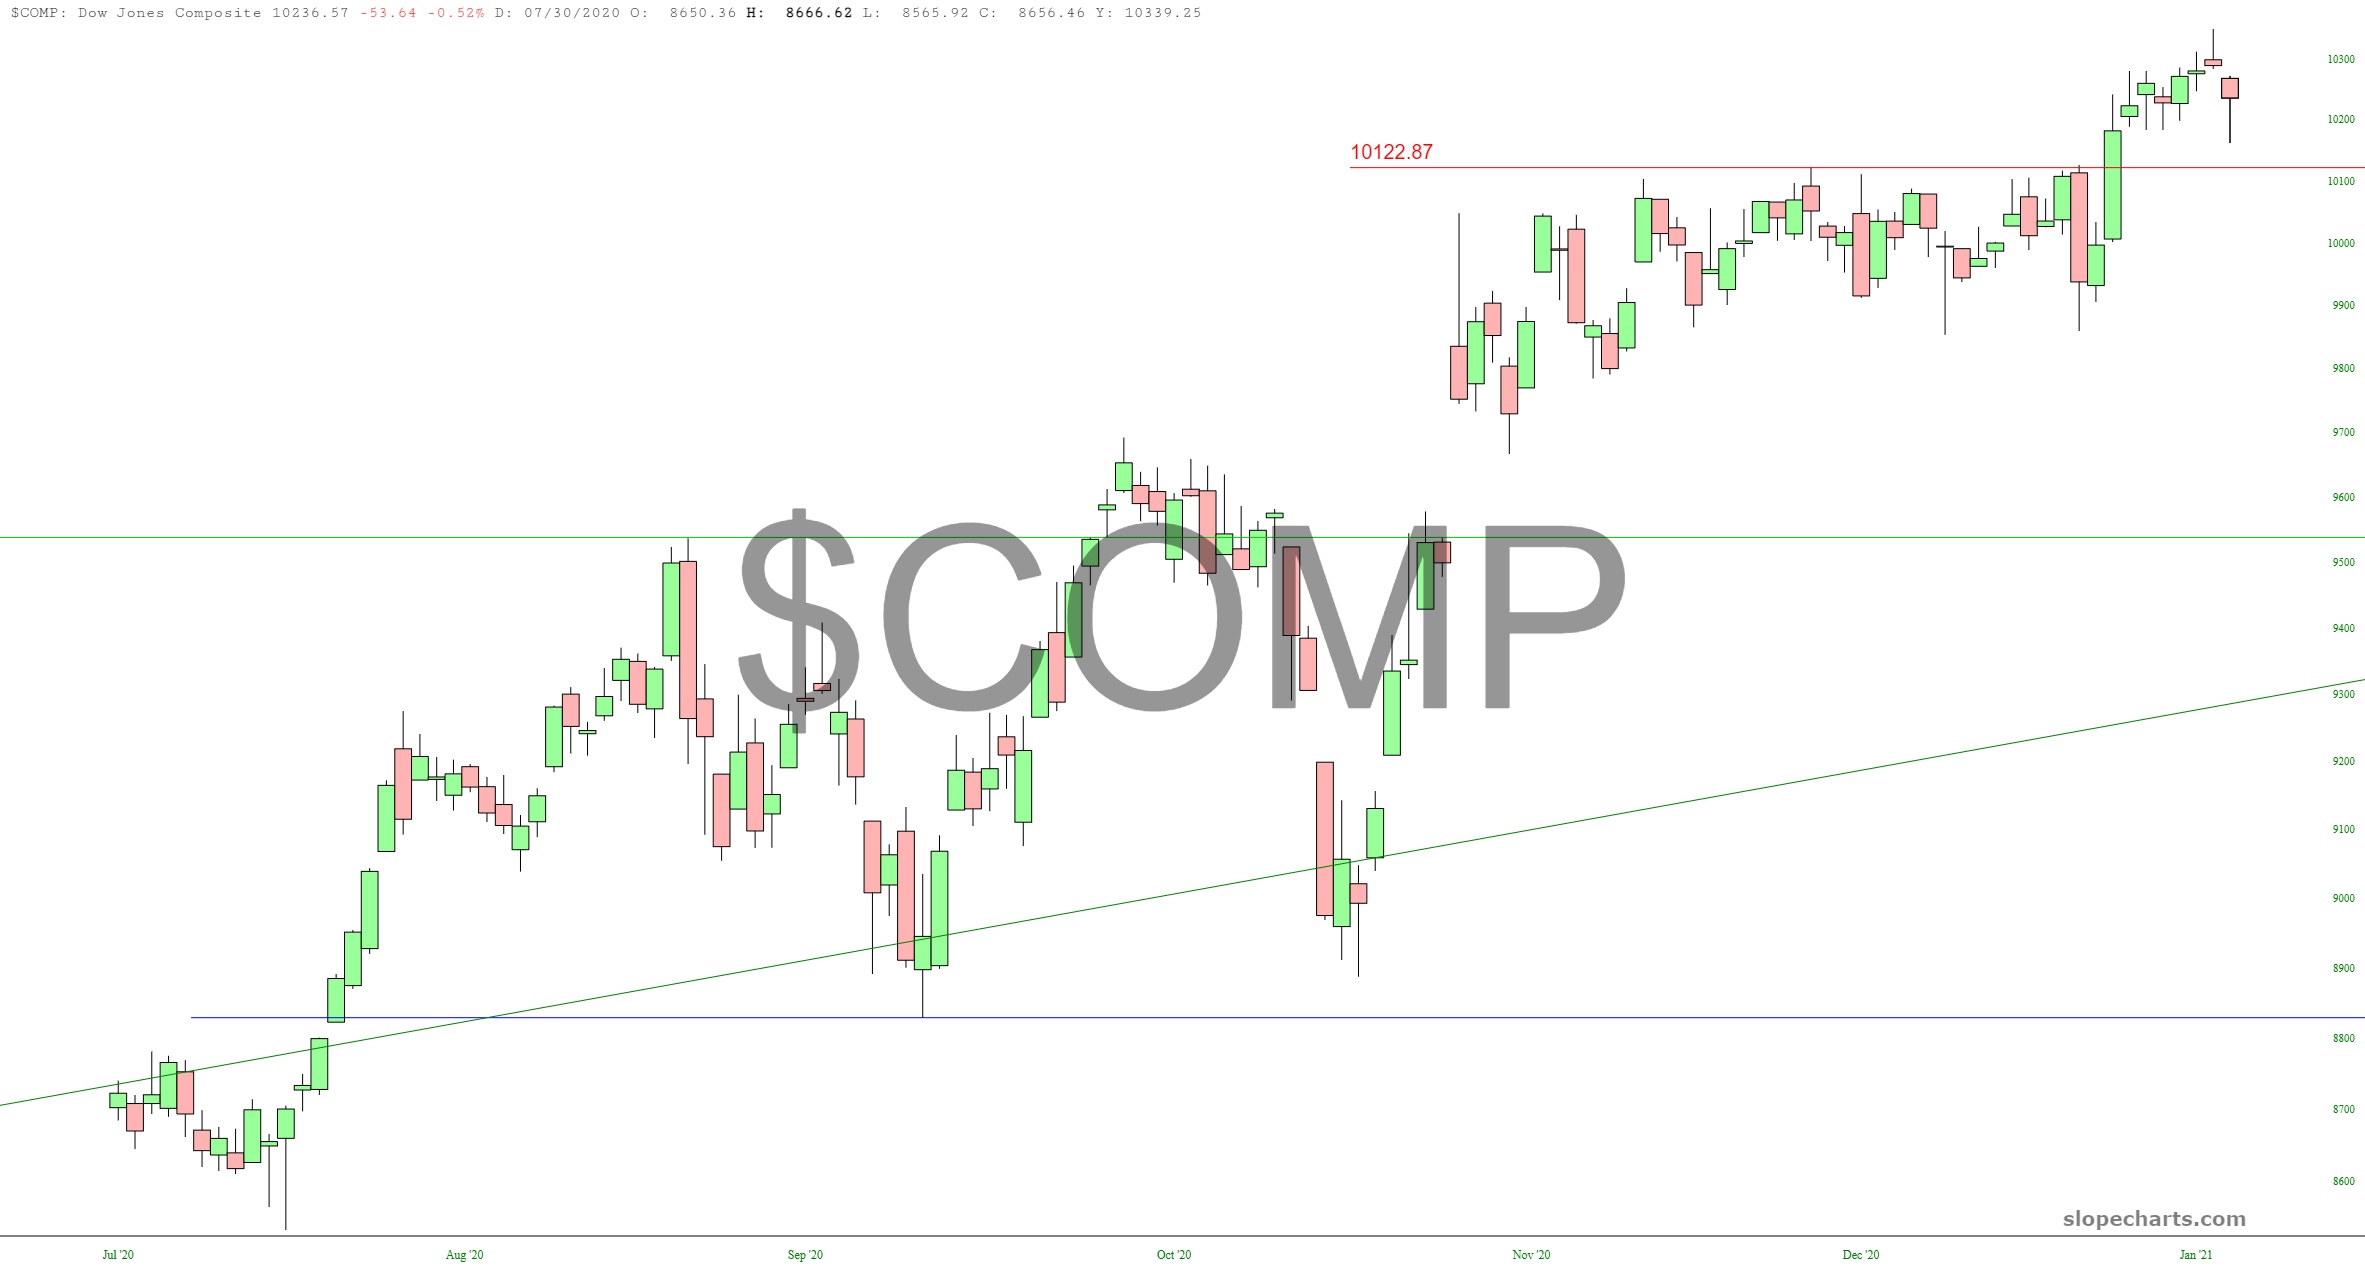
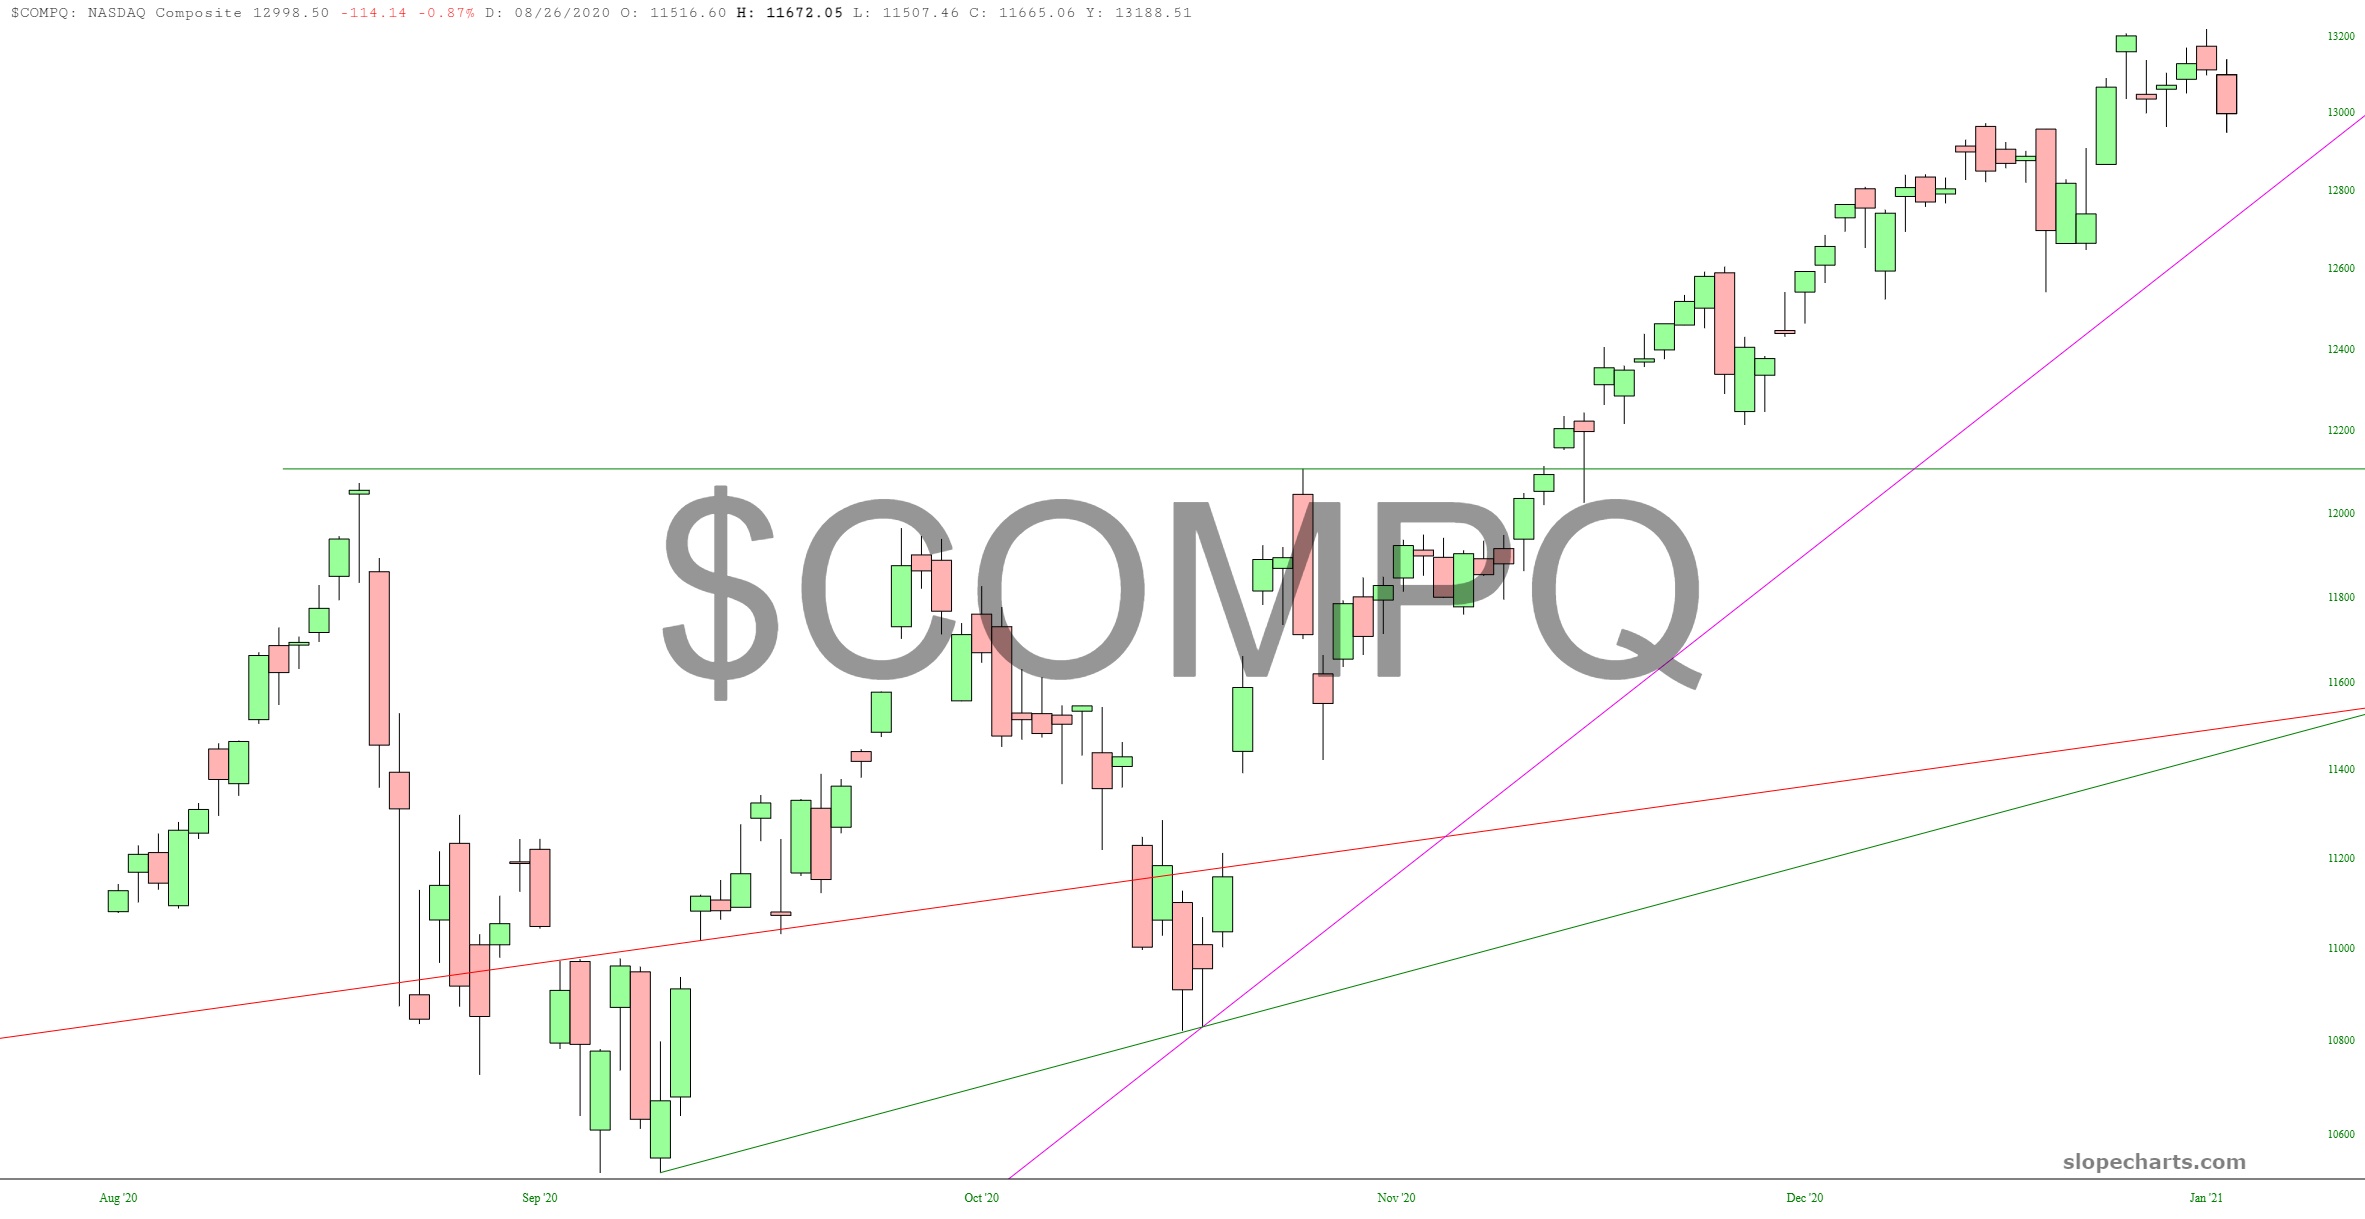
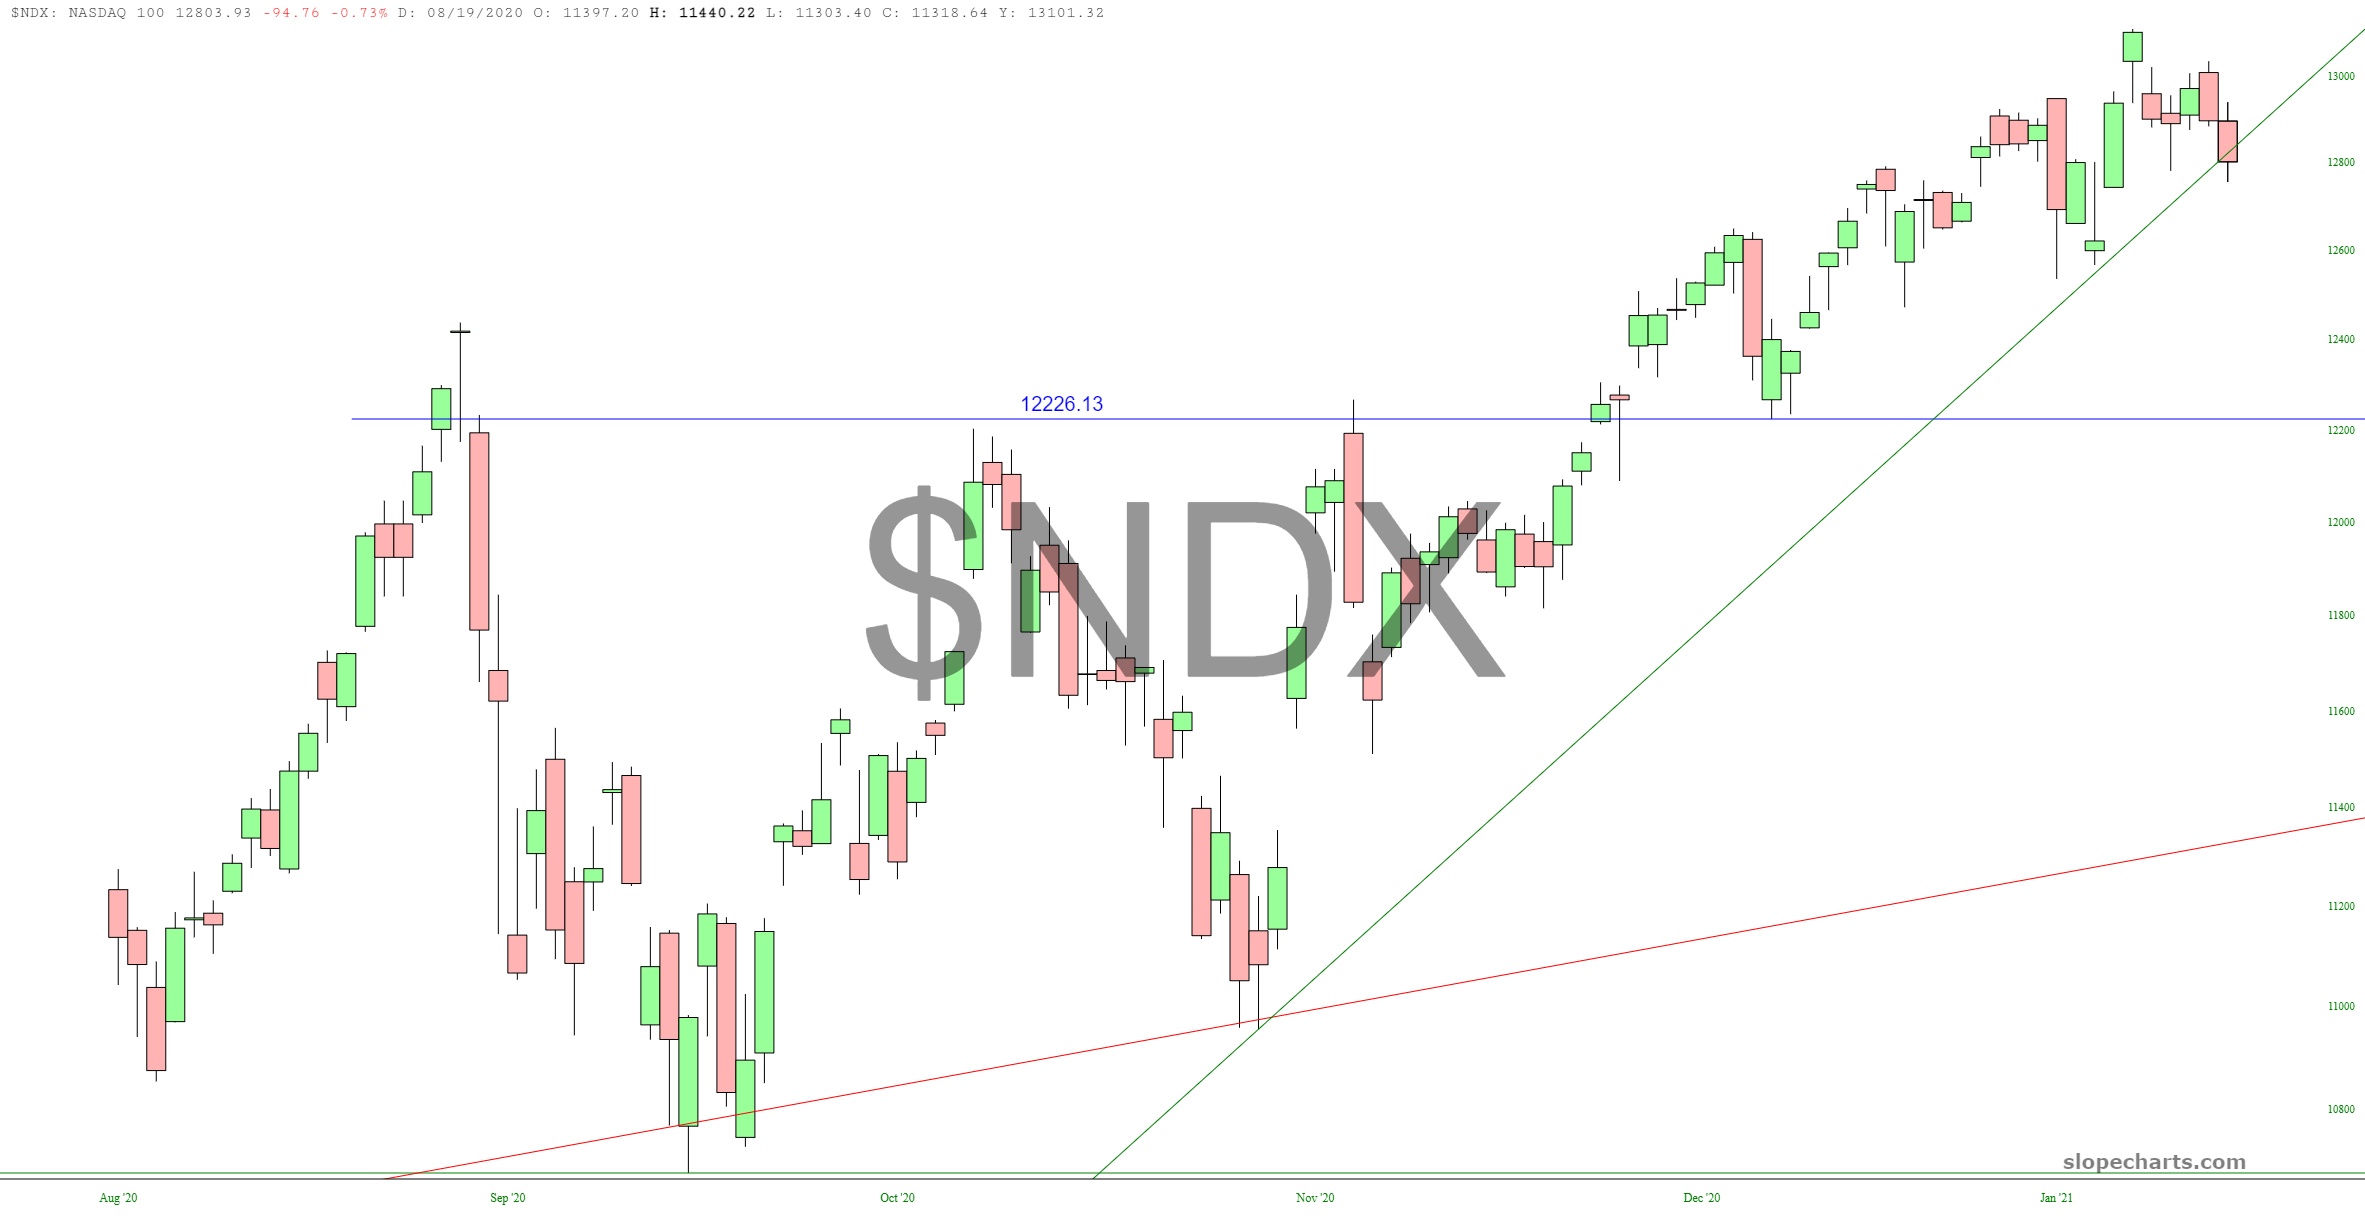
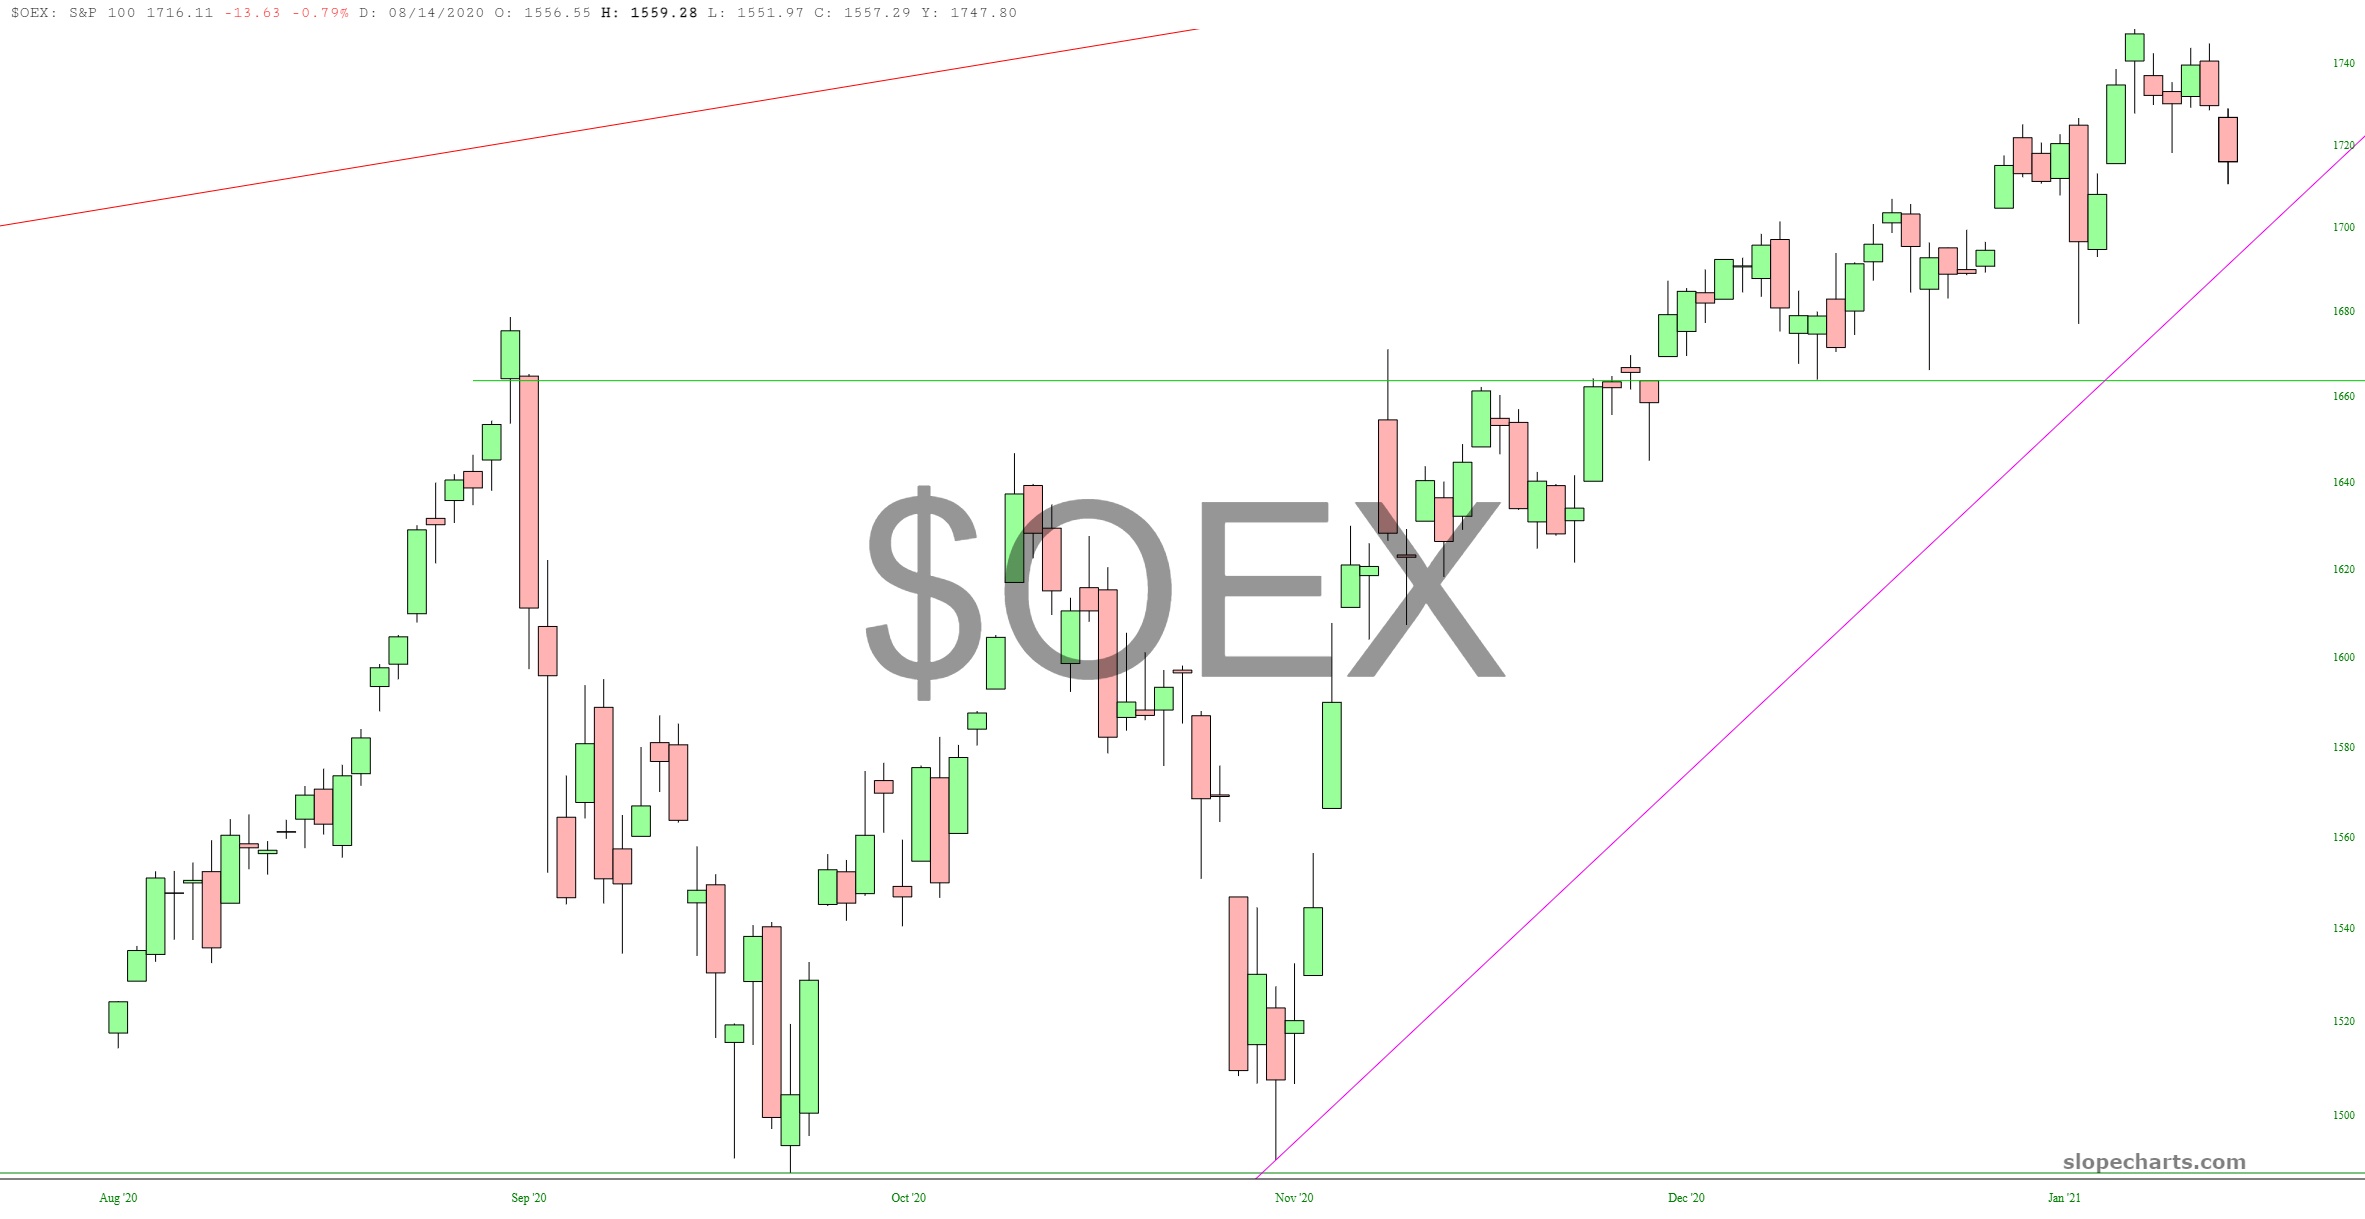
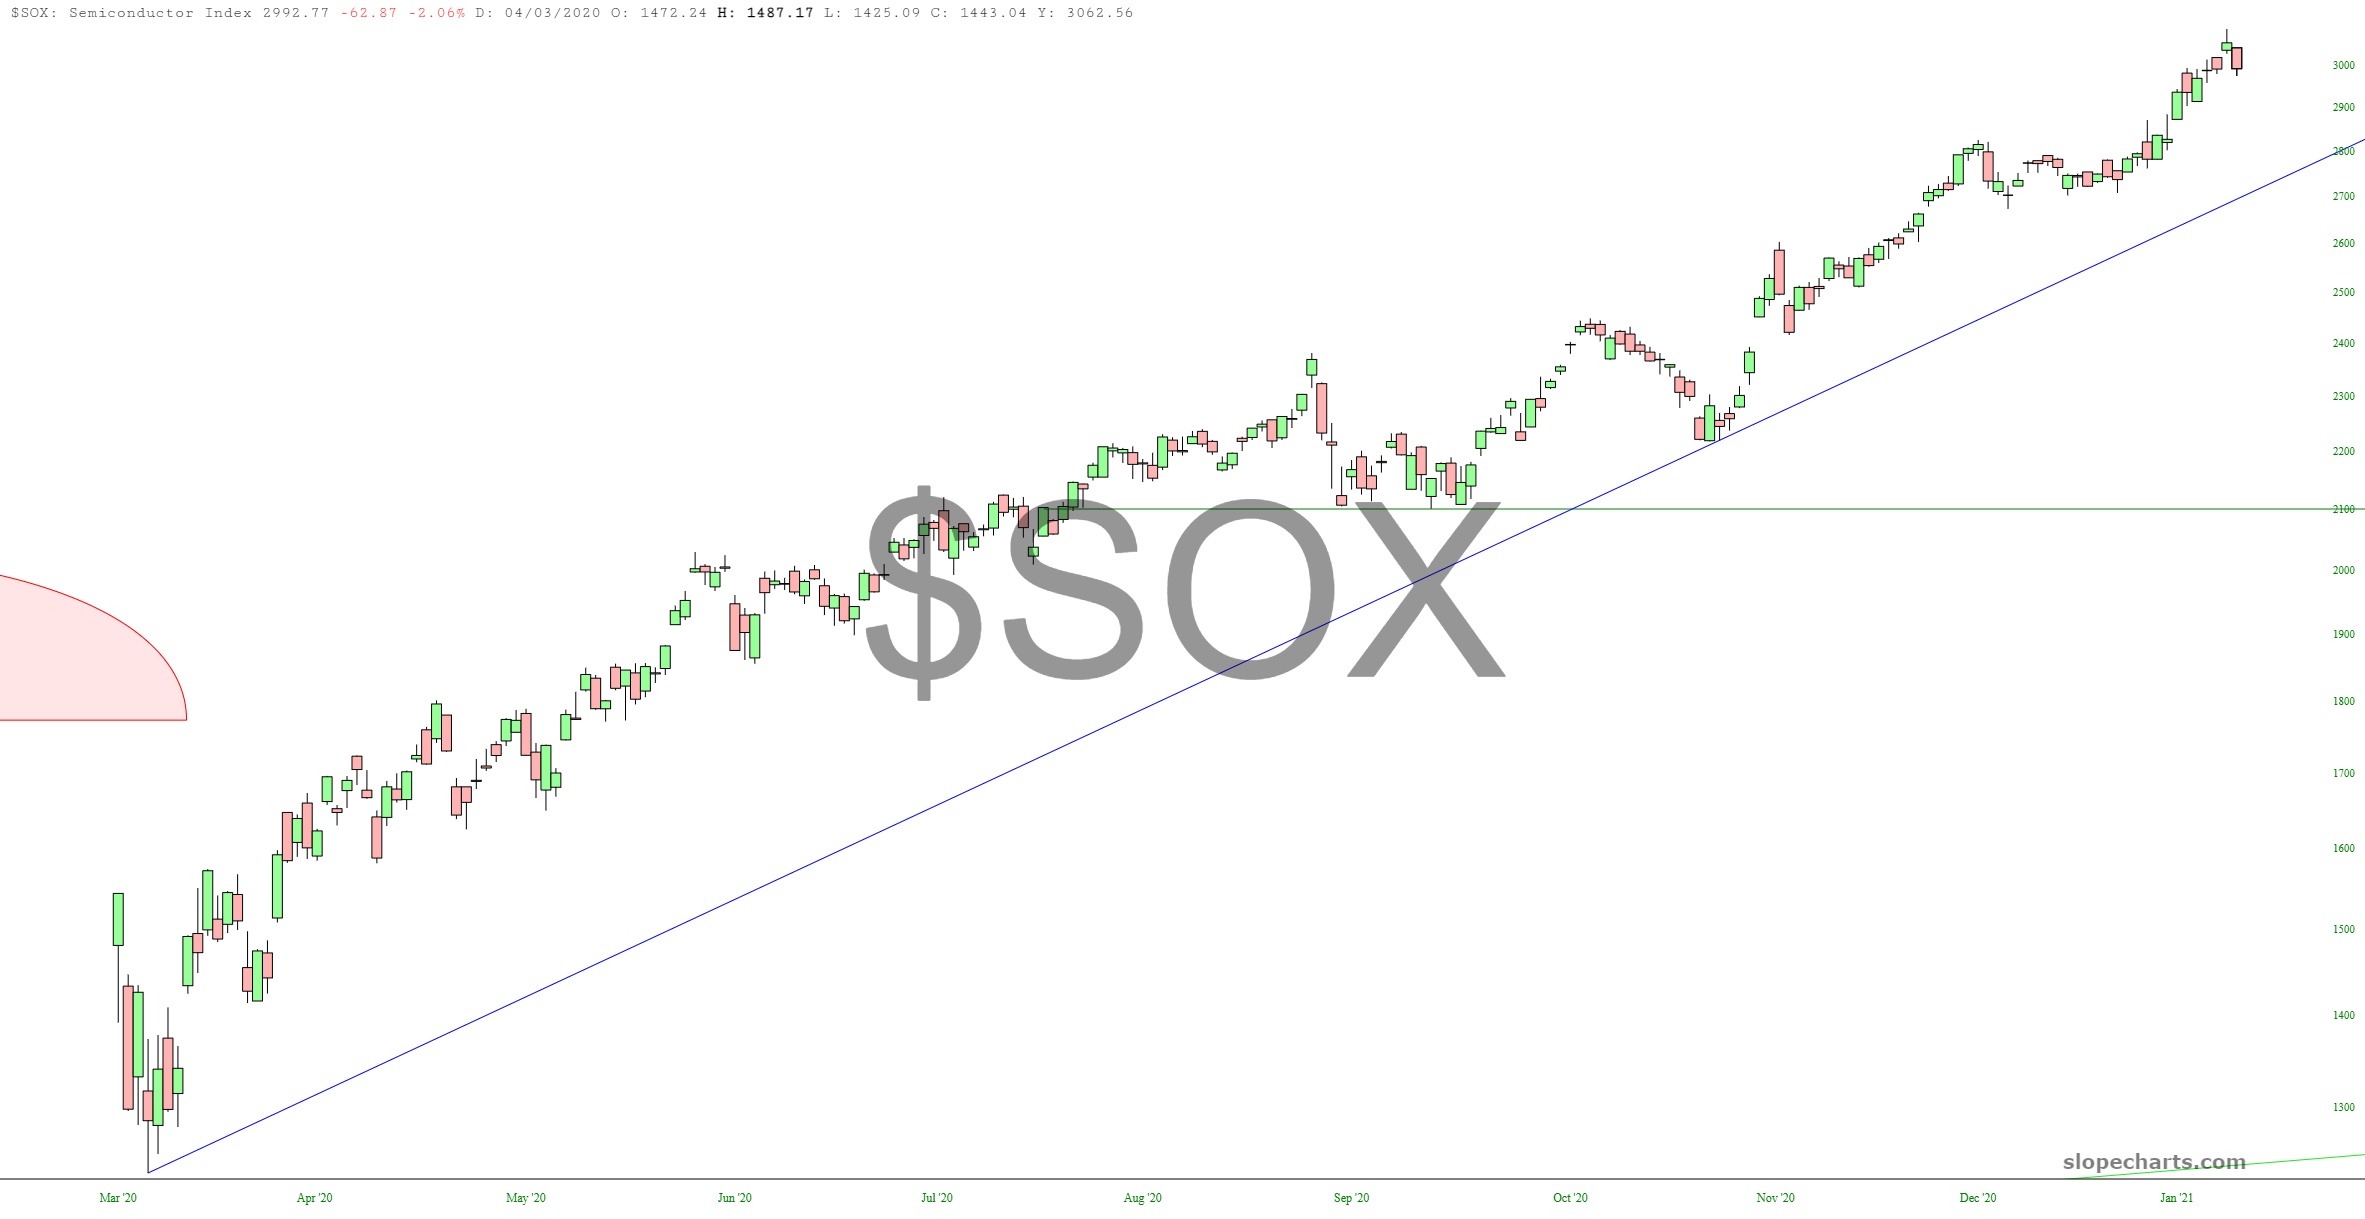
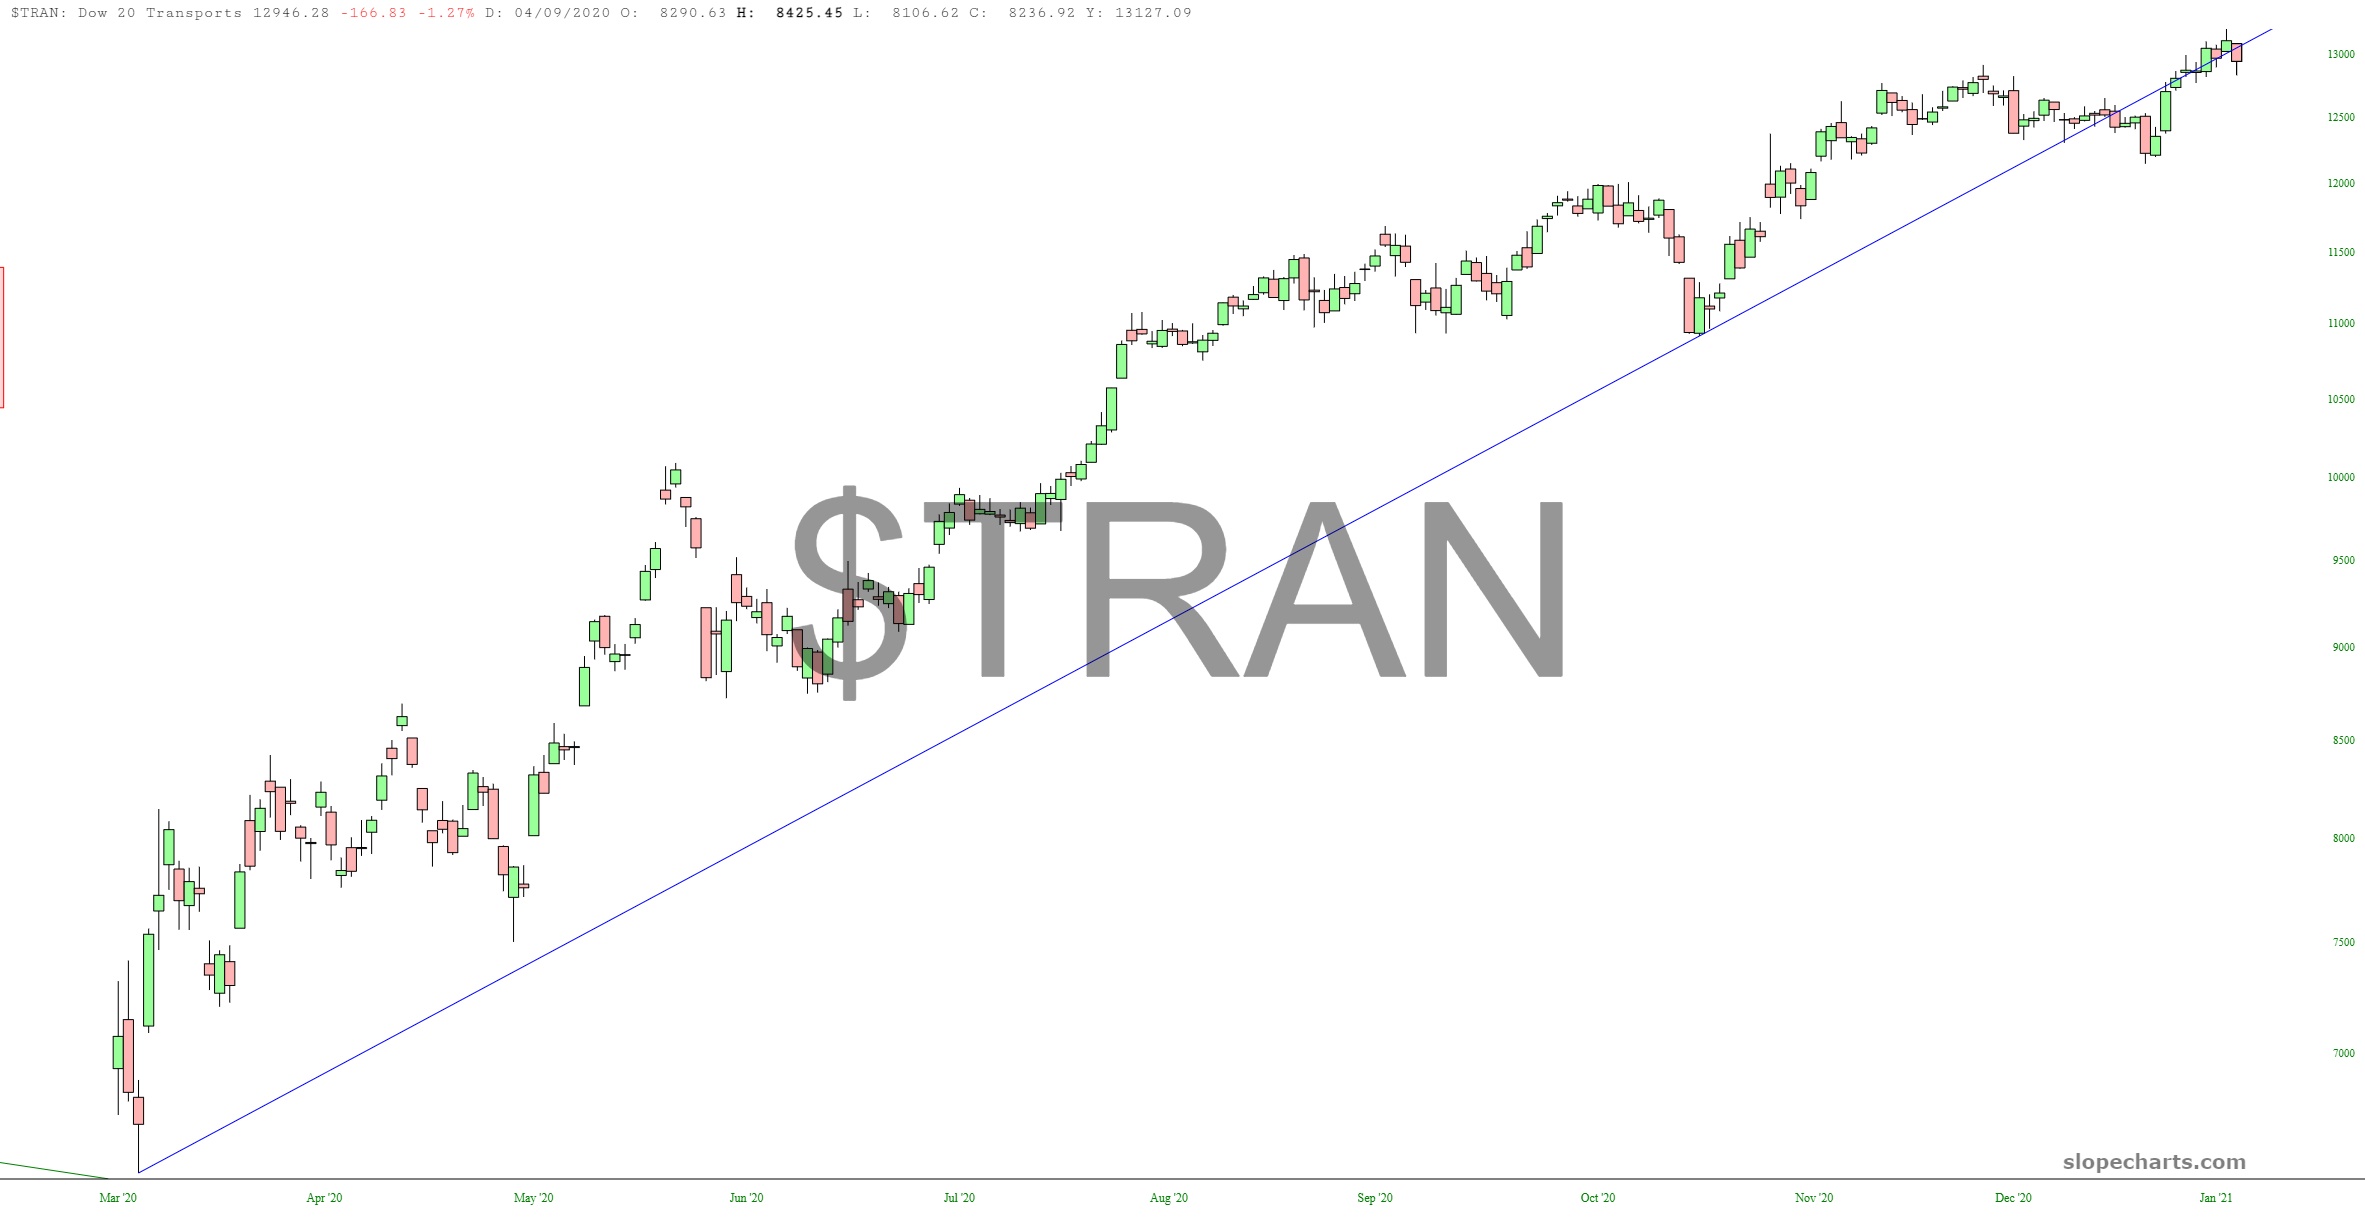
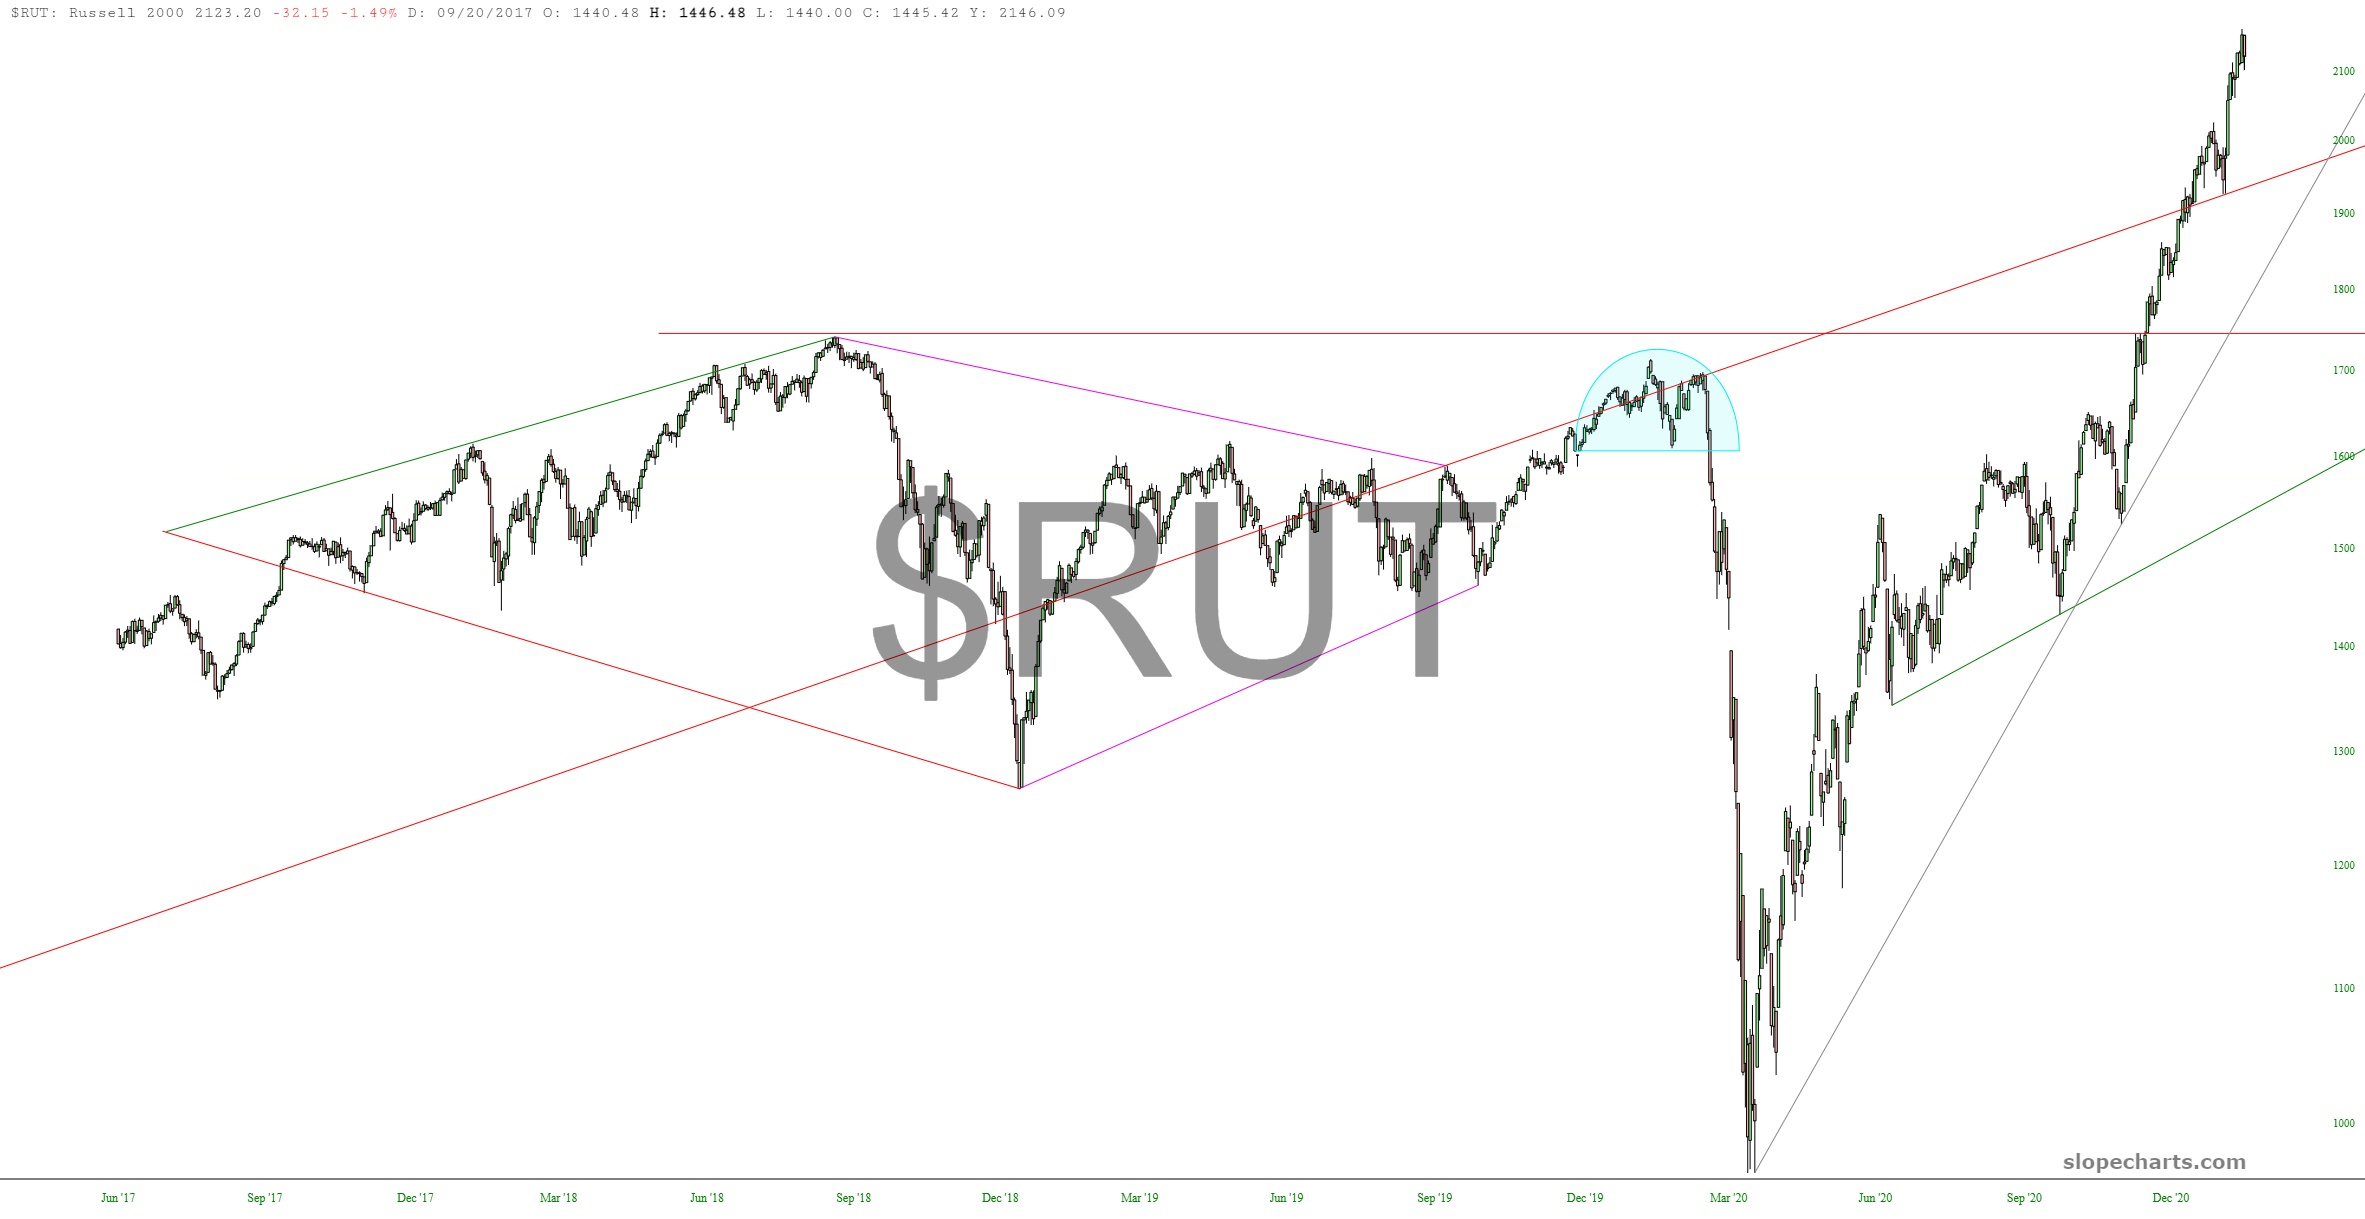
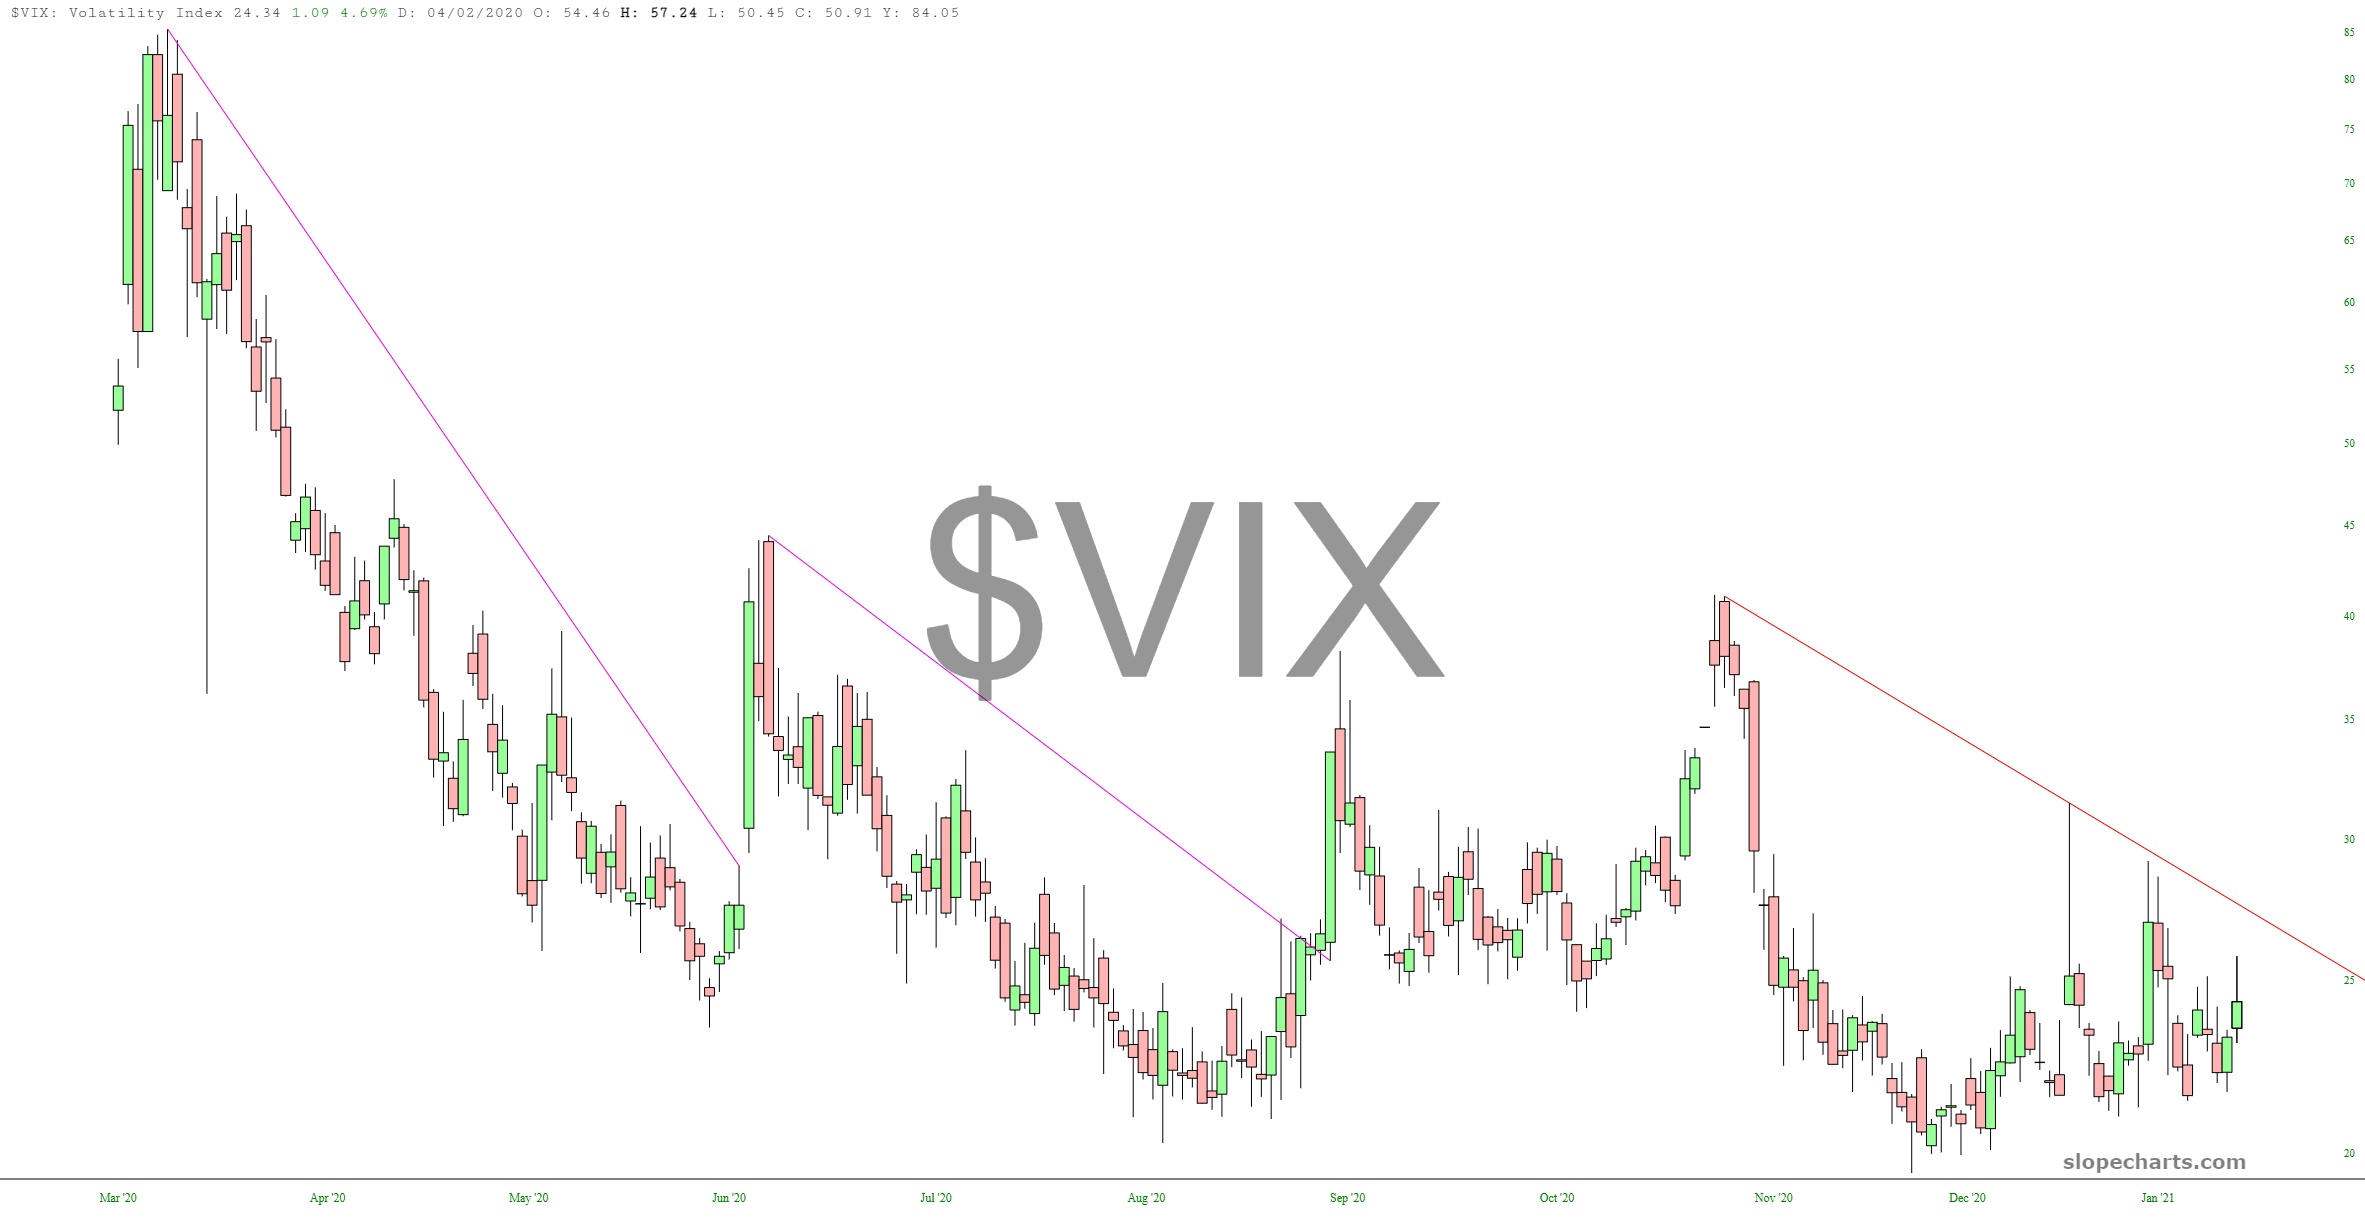
Couldn’t be simpler. The horizontal line whose price I’ve shown.Needs to break that ascending trendline.We were slammed up against that trendline for many weeks. Now prices will treat it as support. We would need to slip below that multi-week range.Trendline breakdown has already started, although just barely.Trendline break required; not far to go.This is a longer-term chart, because the support trendline demands it. It would take some extraordinary damage to break this trend.This trendline is already broken, and prices are hanging on for dear life.This, to me, is the most screamingly bearish chart of all. Almost everyone thinks energy is in for an amazing bull market. I’m the outlier: I think it’s doomed.The most inscrutable, and most overvalued, chart of all is the small caps. All I can say it that it’s at nosebleed levels, and this uptrend is absolutely not sustainable.Lastly, the one and only chart I want to see actually break higher is volatility. Keep an eye on that line.