
I received this email today from one of your fellow Slopers with this information:
Chart 1 Shows SPX with trend lines as follows:
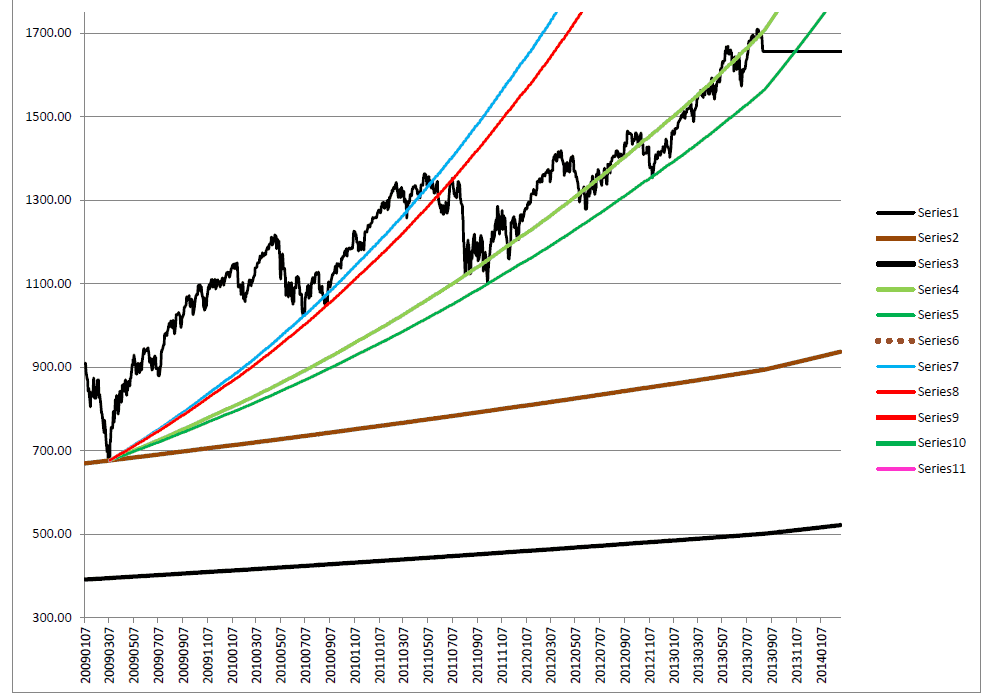
Black line = Trend from January, 1950 through the low in 1974. It represents a CAGR of 5.31%. Current Value = 501.10.
Brown Line = Trend from January, 1950 through the low in March, 2009. It represents a CAGR of 6.22%. Current Value = 893.90.
Dark Green Line represents a CAGR of 18.70% from the March, 2009 low. Current value = 1563.41.
Light Green Line represents a CAGR of 20.65% from the March, 2009 low. Current value = 1705.67.
Can SPX continue to grow at 18% – 20% with corporate revenue dropping? Don’t think so……..
Chart 2 Shows SPX (Blue Line) plus NYSE A/D Line(Green Line).
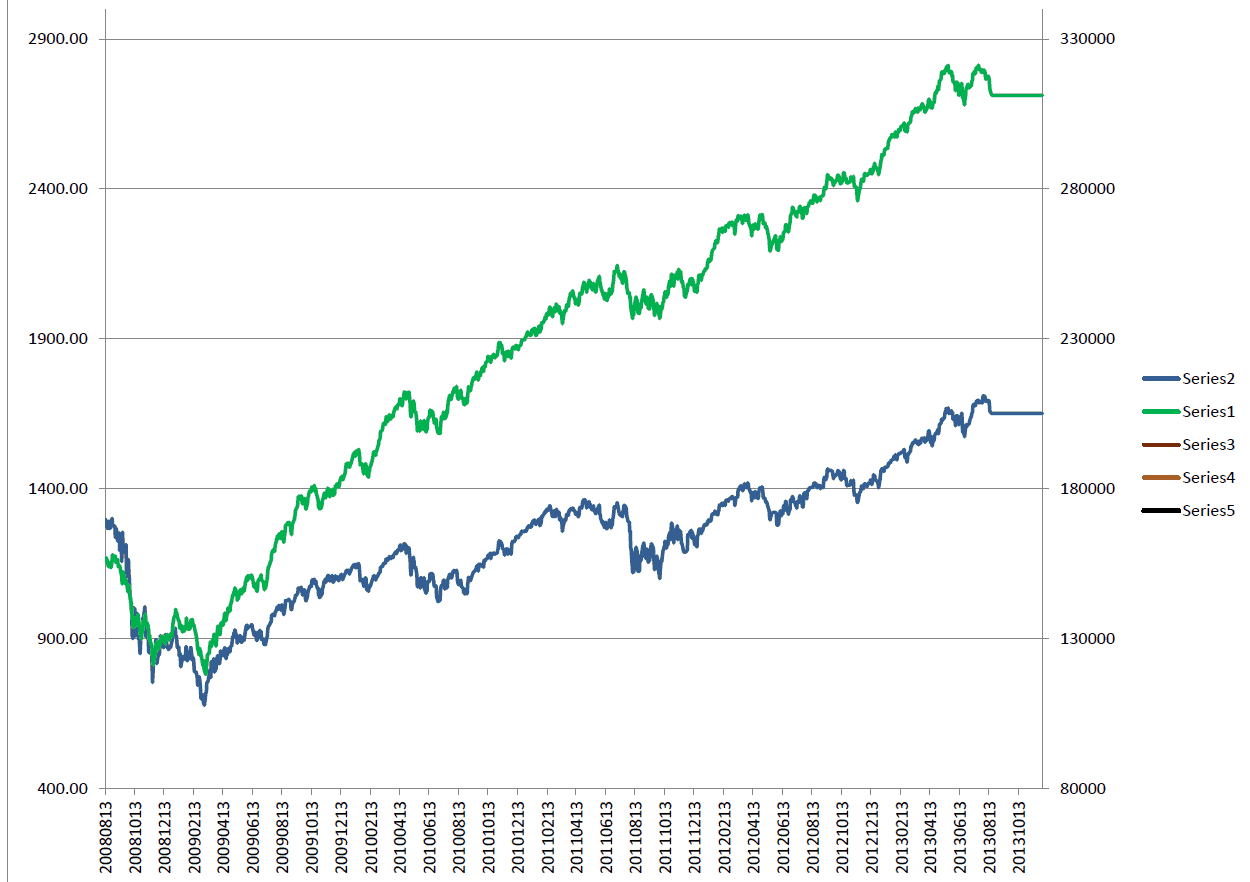
A/D line looks like a long term double top to me.
Hold your shorts and puts.
