
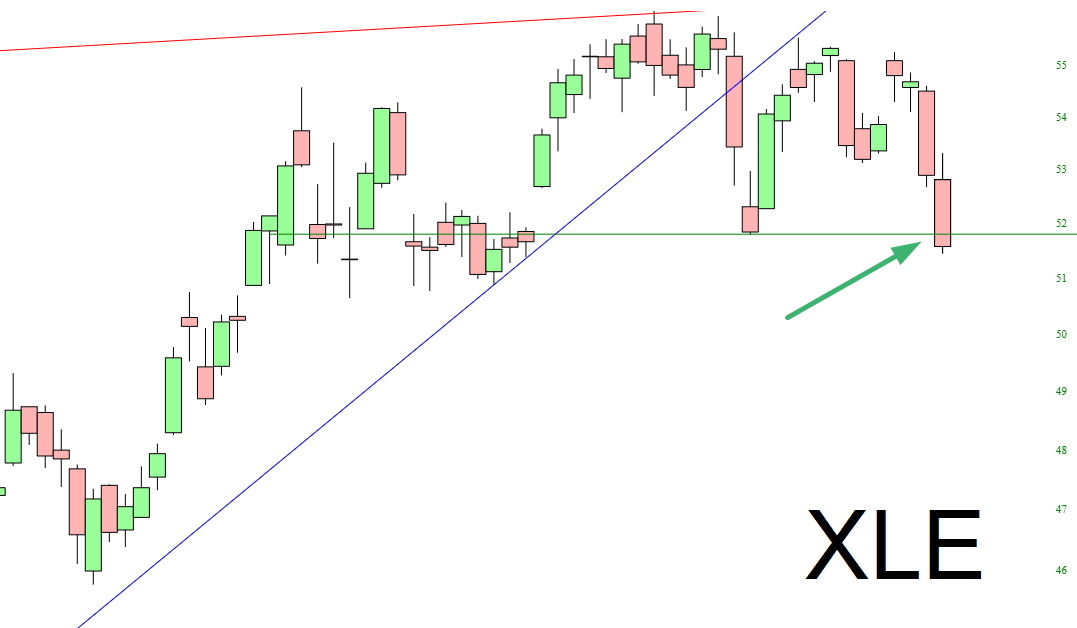
Well, Tim the Energy Bear is thriving these days. And we now have a core breakdown.
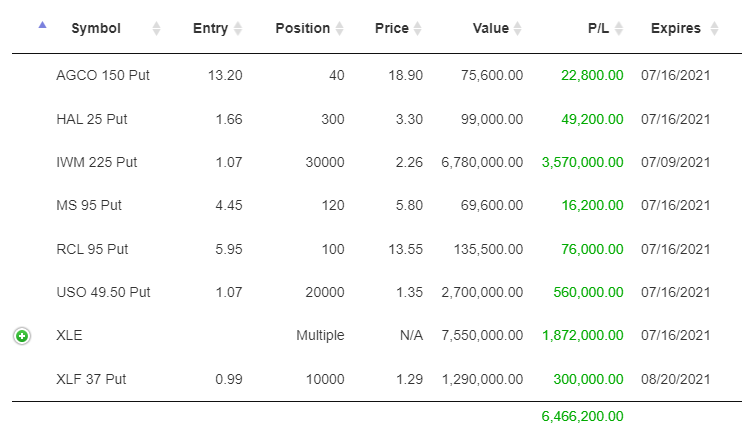
Let’s just say my First Place Lead in virtual trading is widening……..
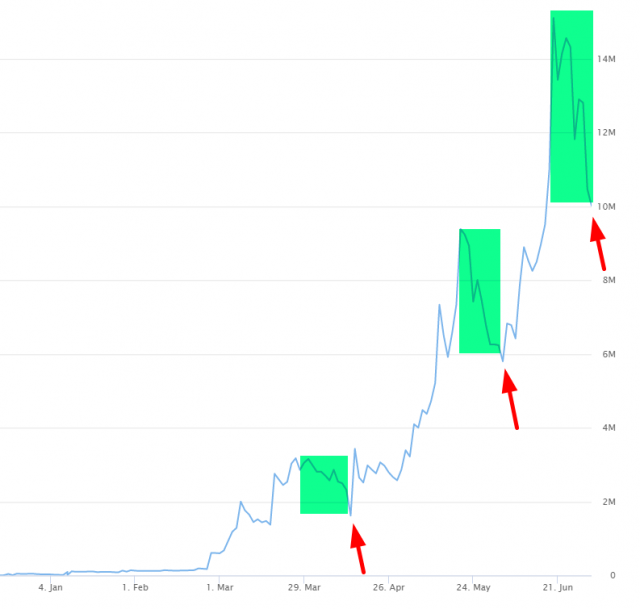
Remember THIS post from last week? I had said:
Over the years, people have suggested many times that I reveal the traffic graph for Slope as a contrary indicator for the market. I think I’ve got a better idea. Looking at my own equity curve from the Top Ten Traders page, we can see I’ve lost over $5 million, a third of my account’s value. I’d like to suggest in times past these mega-plunges have been met in turn with explosions to a new high (in other words, a weak stock market). We shall see!
Well, we’ve gone from this:
……to this……..
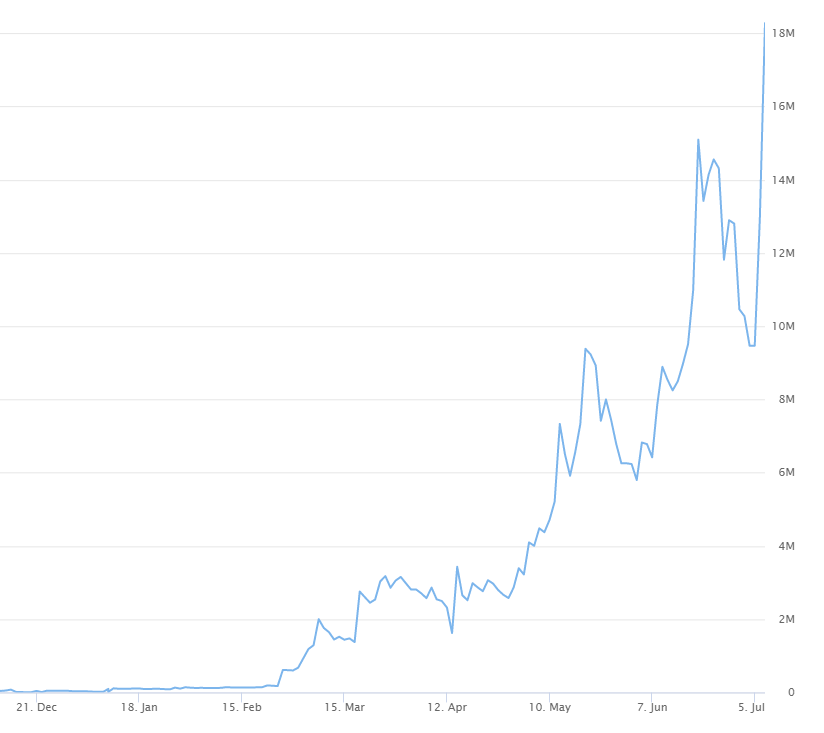
So………..good guess.
