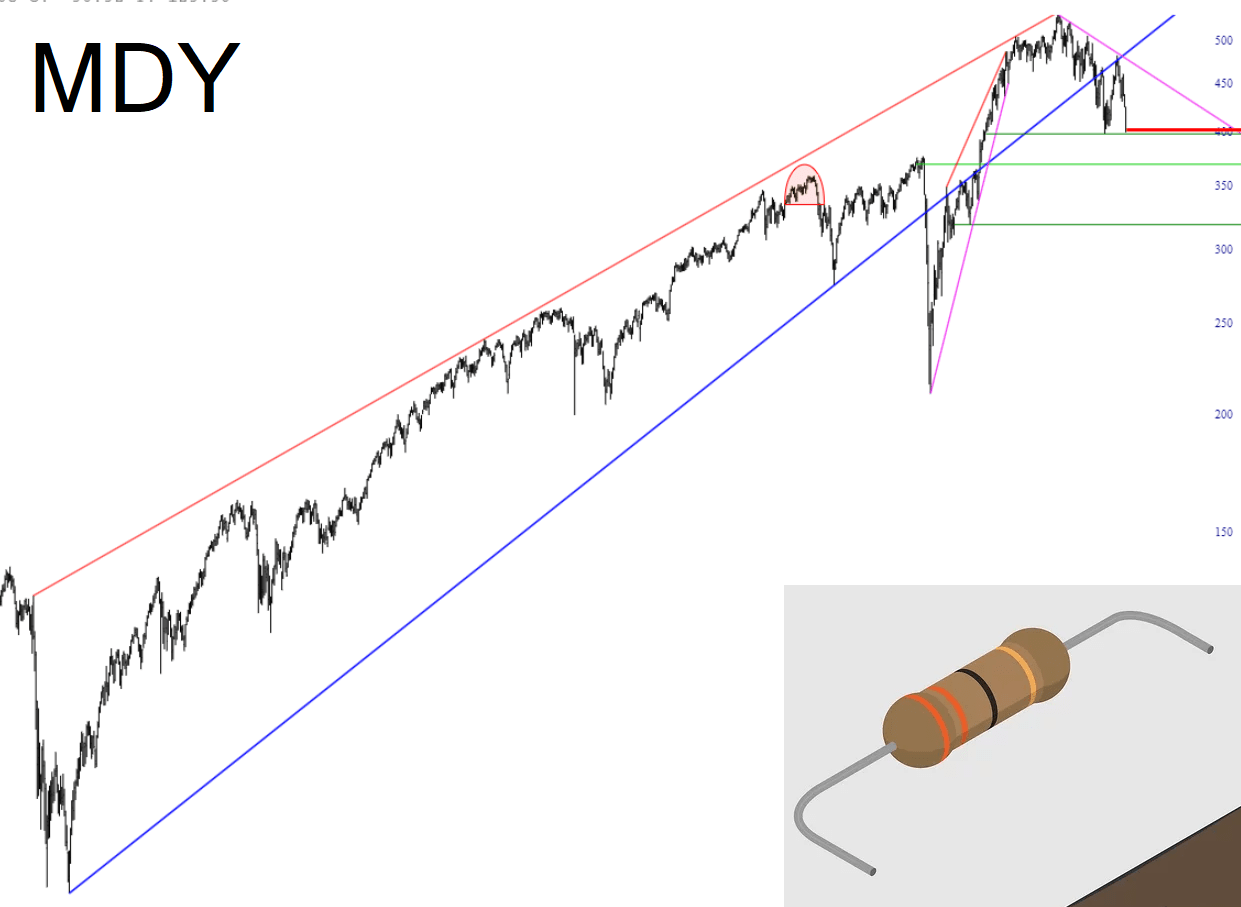
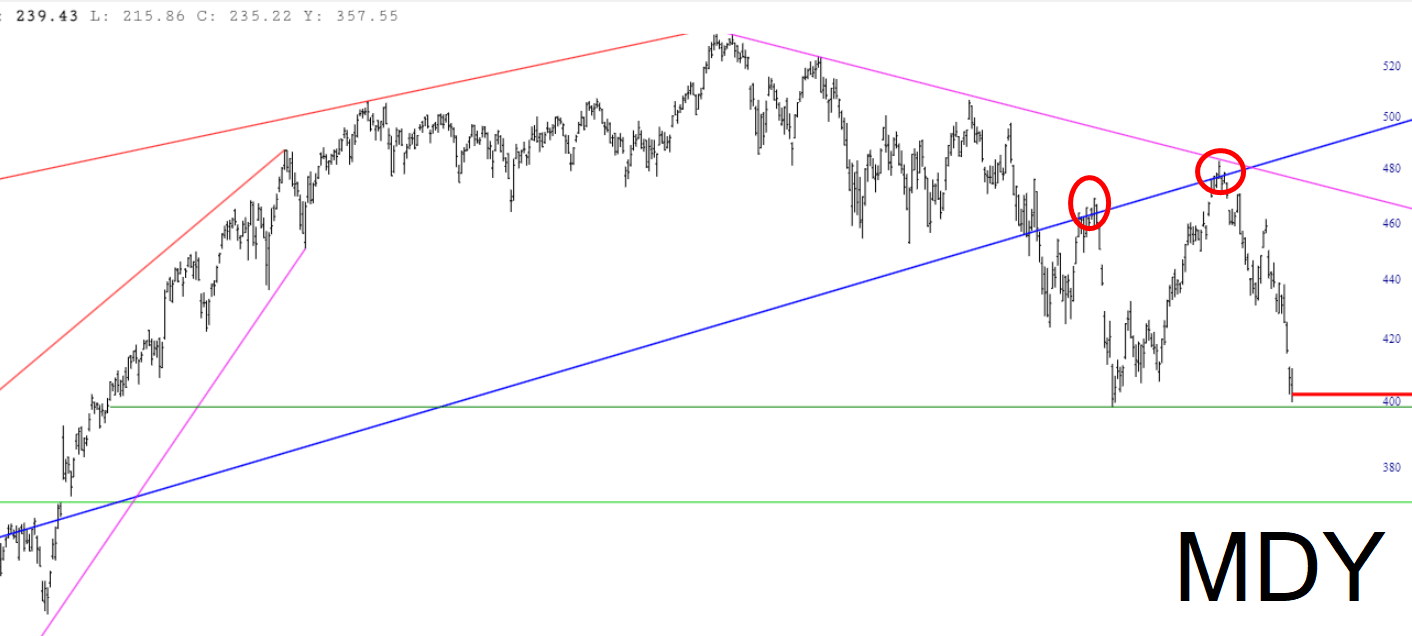
This year has been an embarrassment of riches when it comes to beautiful charts. Here is another one: the MIdCap 400 ETF symbol MDY. Take note of the two instances in which the trendline, formerly support, now resistance, did a beautifully job shoving prices right back down where they belong.
The extraordinary thing is the length of this trendline, spanning all the way to the financial crisis bottom. I confess I “cheated” on this one by ignoring the Covid low, but there are rare instances when this is appropriate (and I set this anchor points months in the past, now just now).