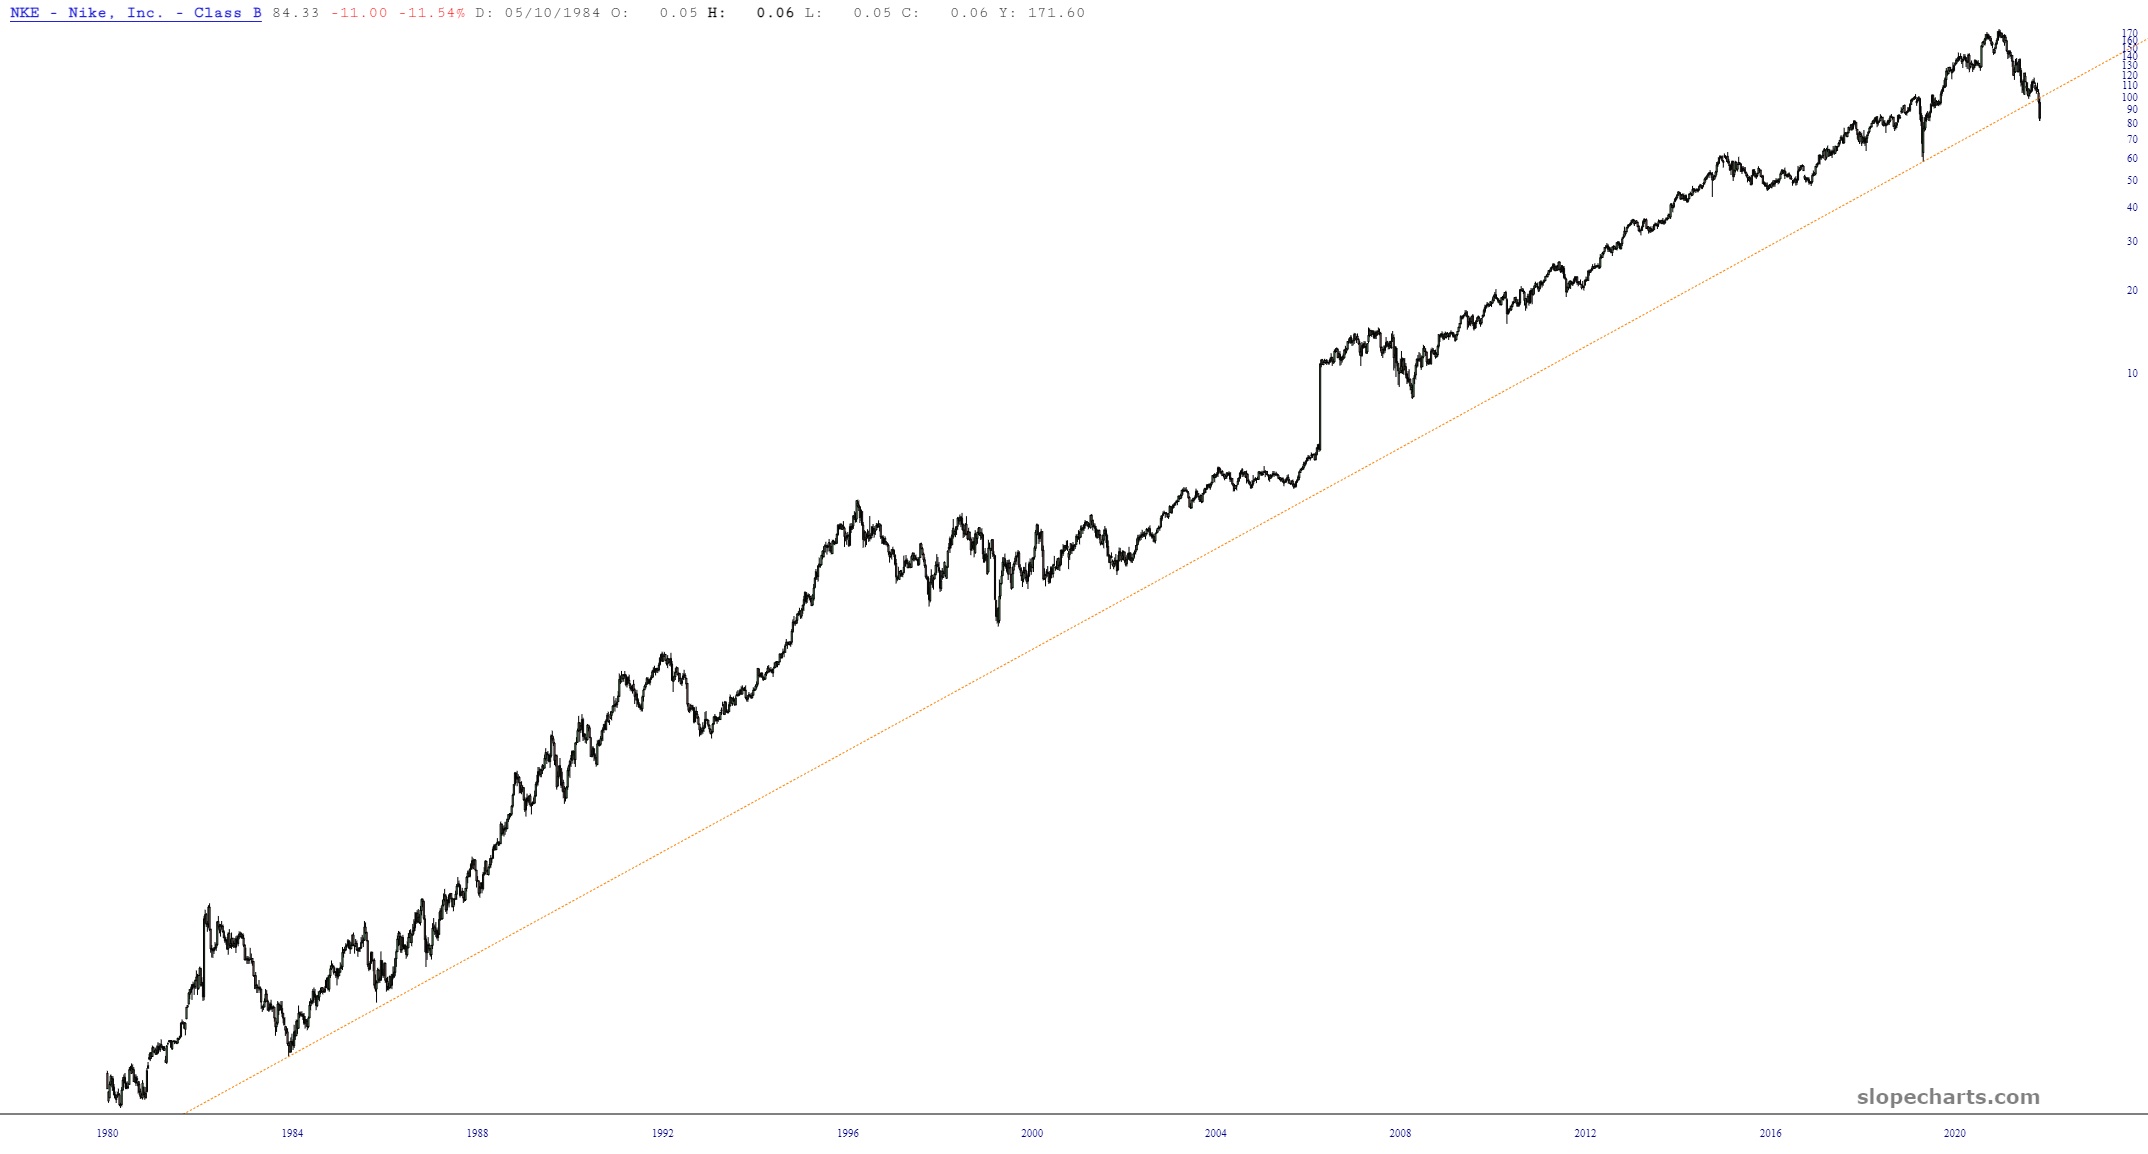
Nike is one of those stocks which, like McDonalds and Home Depot, I have tended to utterly avoid. There are among the rapidly-shrinking group that I called “perma-risers”, since they do little but ascend in value year after year. Thus, I don’t look at these charts, which explains why I totally missed this one. As you’ve heard, Nike (NKE) is getting absolutely bombed this morning, but the trendline failure from an entire week ago gave us the heads-up (or would have, I should say).
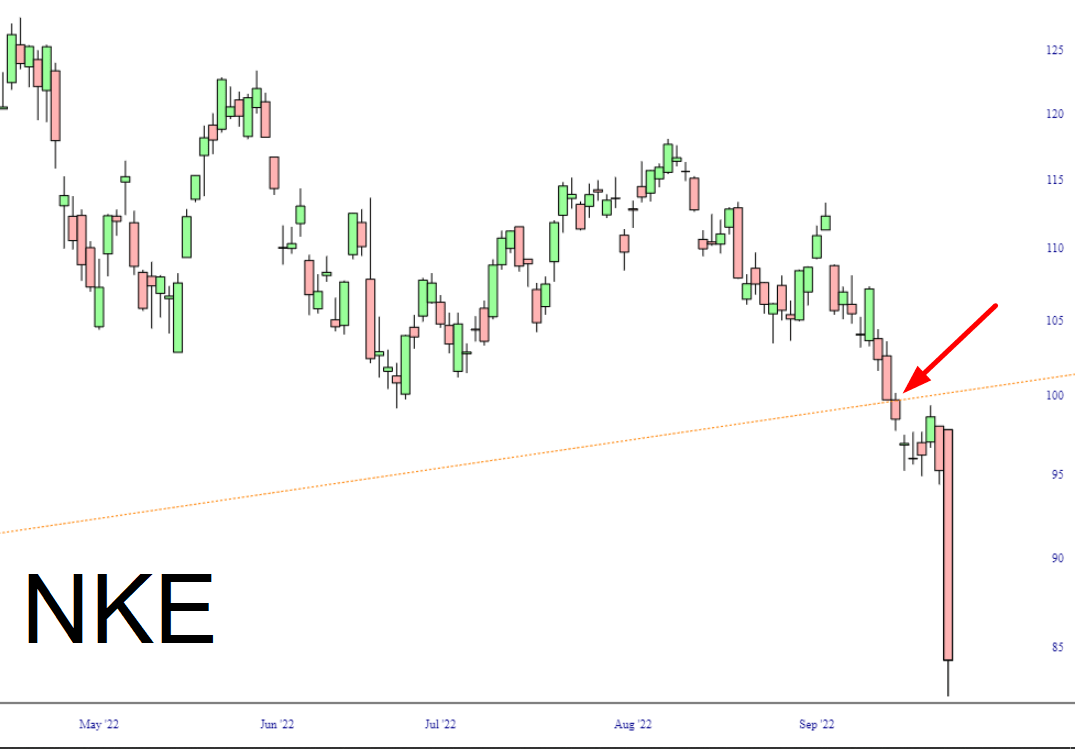
For, as you can see here, this is no minor trendline. Instead, it represents the entire history of the decades Nike has been a public entity. What I’m trying to say here is that this trendline failure is unprecedented, extraordinary, and provided a full five-trading-day warning that something was seriously wrong.