To my eyes, this is incredible. Below is the long-term continuous contract of the S&P 500 futures (/ES). Take note of the Fibonacci Retracement Levels, which are anchored to the highest point in history (a year ago) and the bottom of the financial crisis.
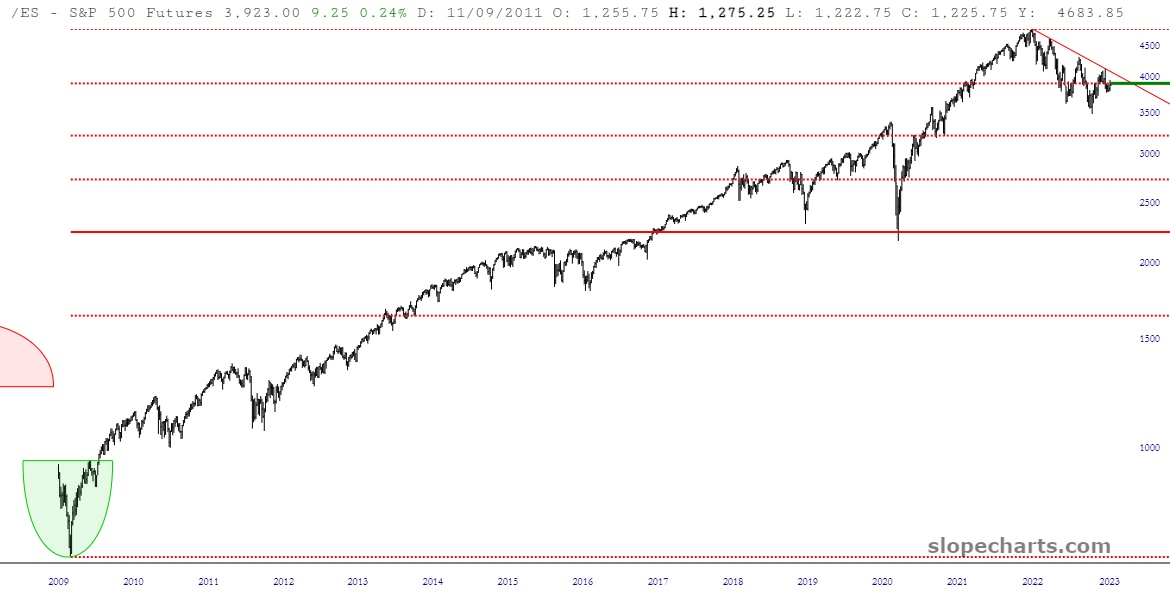
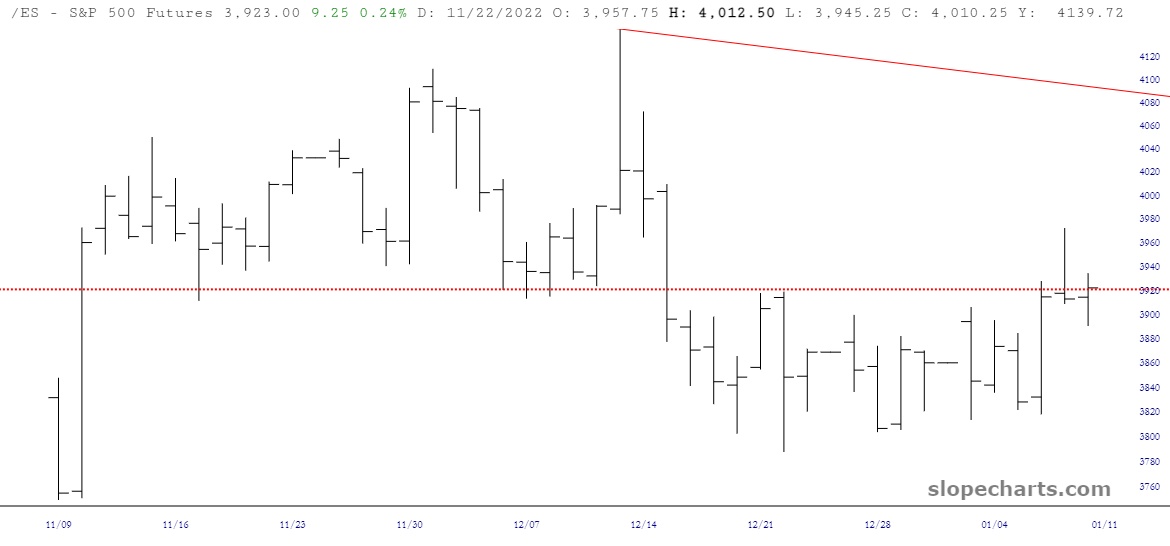
Just take a look at what’s been going on for the past three months with respect to prices and the 78.6% level. It’s jaw-dropping to me how much power this simply little line has over prices. That probably helps explain why yesterday’s rally fell to pieces.