
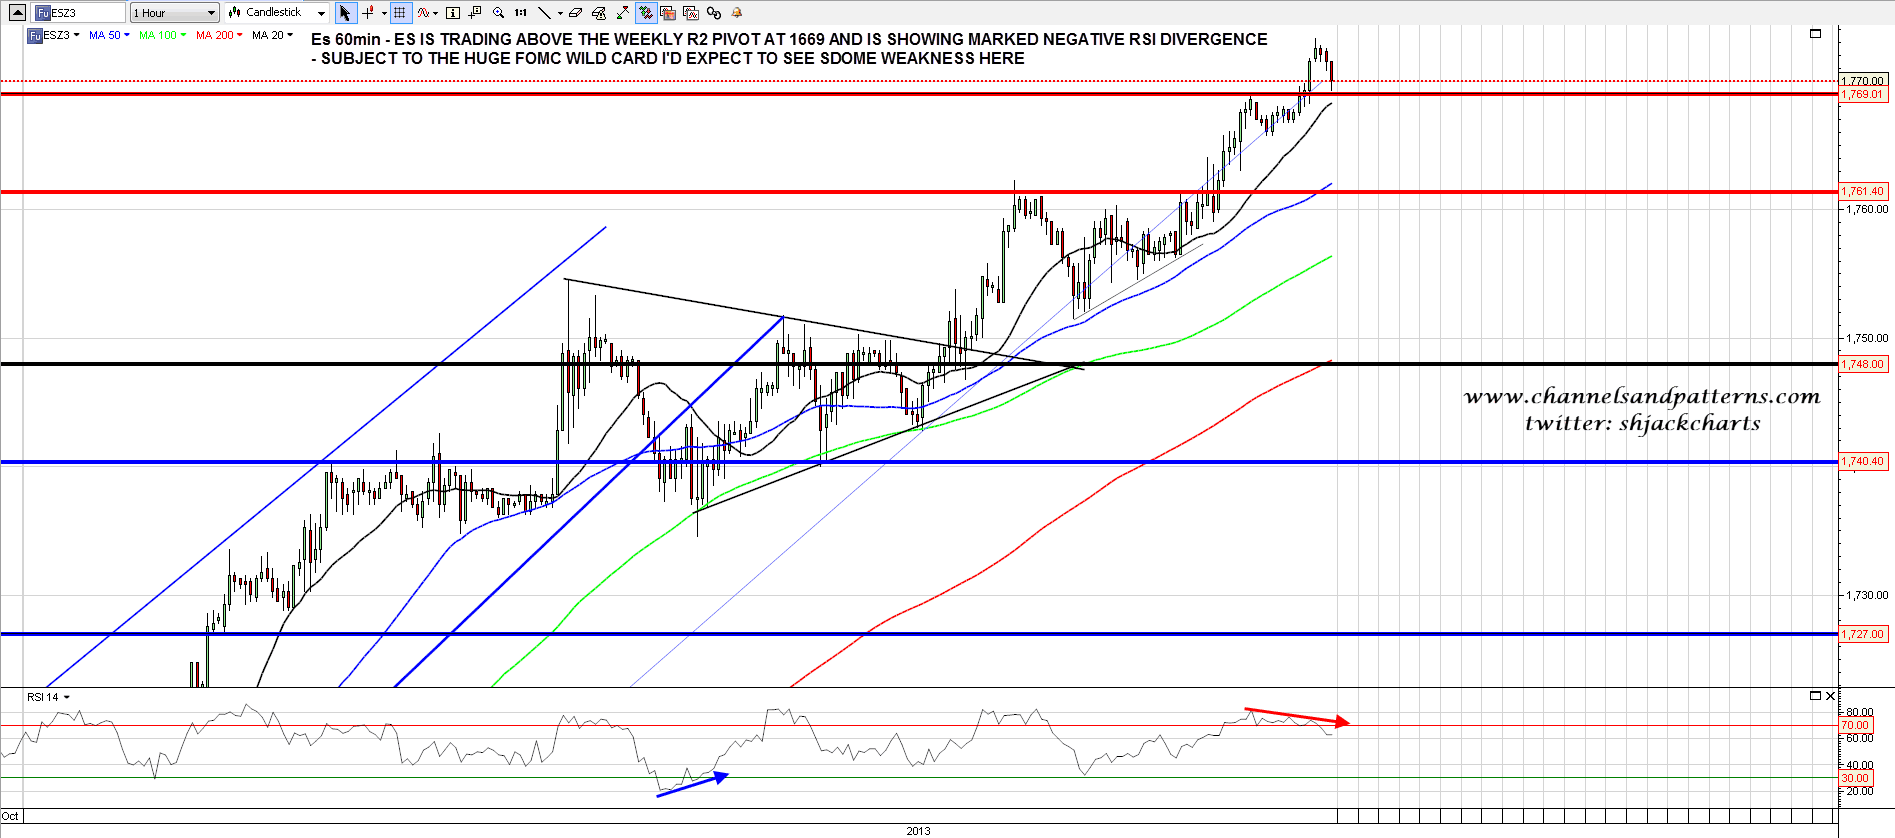
Three weeks ago today, near the low for the last move down, I was writing that the weekly S2 pivot was decent support, and that while ES was then below it, there was a good chance that it would close the week back above it. Today ES has broken above the R2 pivot at 1769, and given that the weekly upper bollinger band on SPX is in the same area, there is a very good chance that ES will close the week back below it. What I’m also seeing this morning on ES is that there is confirmed negative divergence on the 60min RSI, the confirmation being that RSI has dropped below the low made after the first RSI peak. Will ES decline from here this week? FOMC may determine that of course but in normal circumstances that would be likely. ES 60min chart:
I mentioned that there was a possible rising channel support trendline on the SPX 60min chart yesterday and that is still intact today and clearly acting as support. That’s good because any break below that should now be a serious signal of weakness, and equally while SPX stays above it there’s not much to get excited about on the short side. SPX 60min chart:
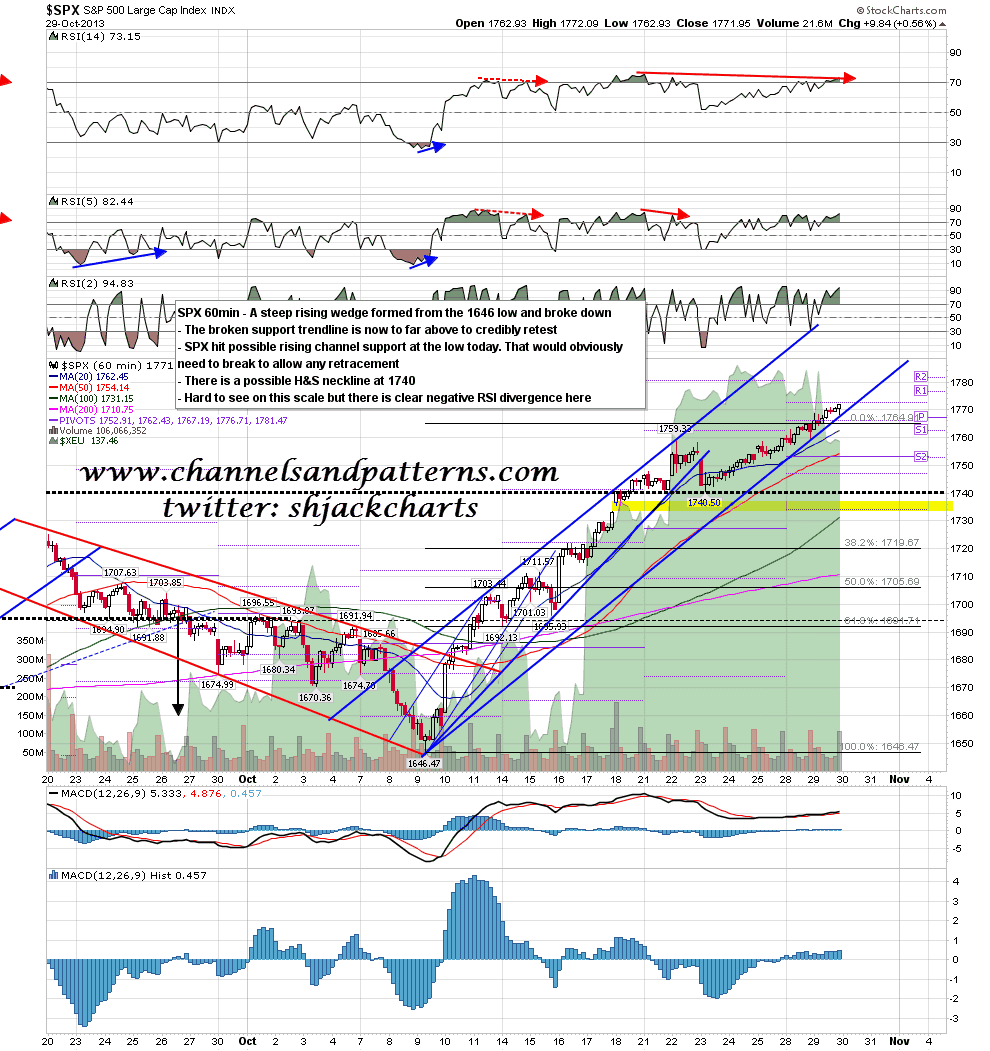
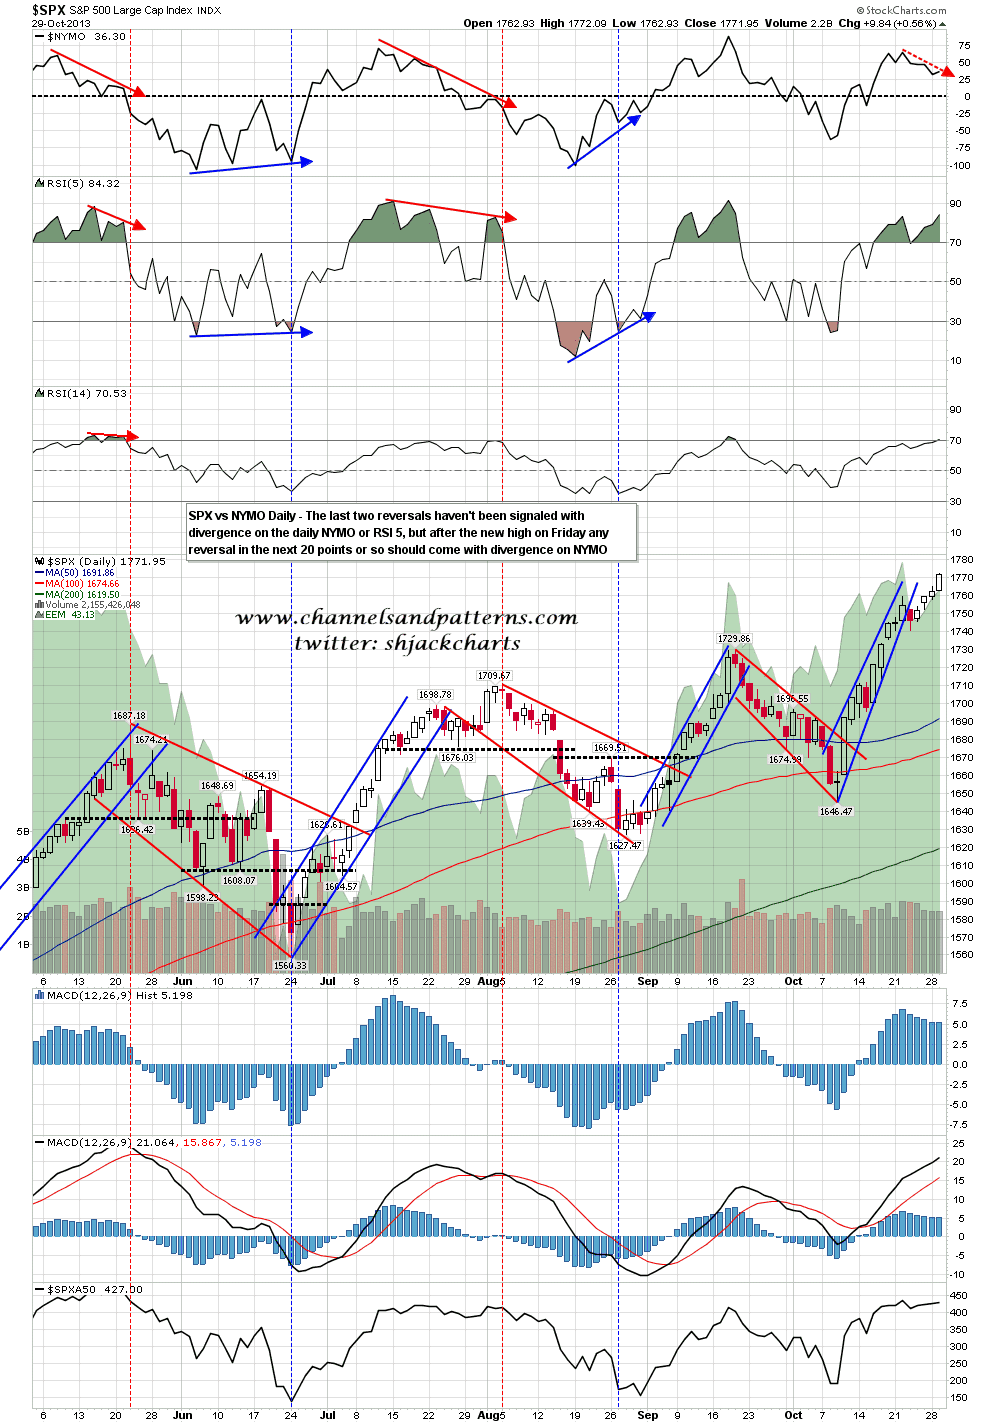
For any big reversal in the last two days there would have been daily NYMO and RSI 5 negative divergence to confirm the high. Unfortunately the RSI 5 made a new high yesterday so that only the NYMO divergence remains today. There is still clear negative divergence on the ES and SPX 60min RSI 14s though. SPX daily chart vs NYMO:
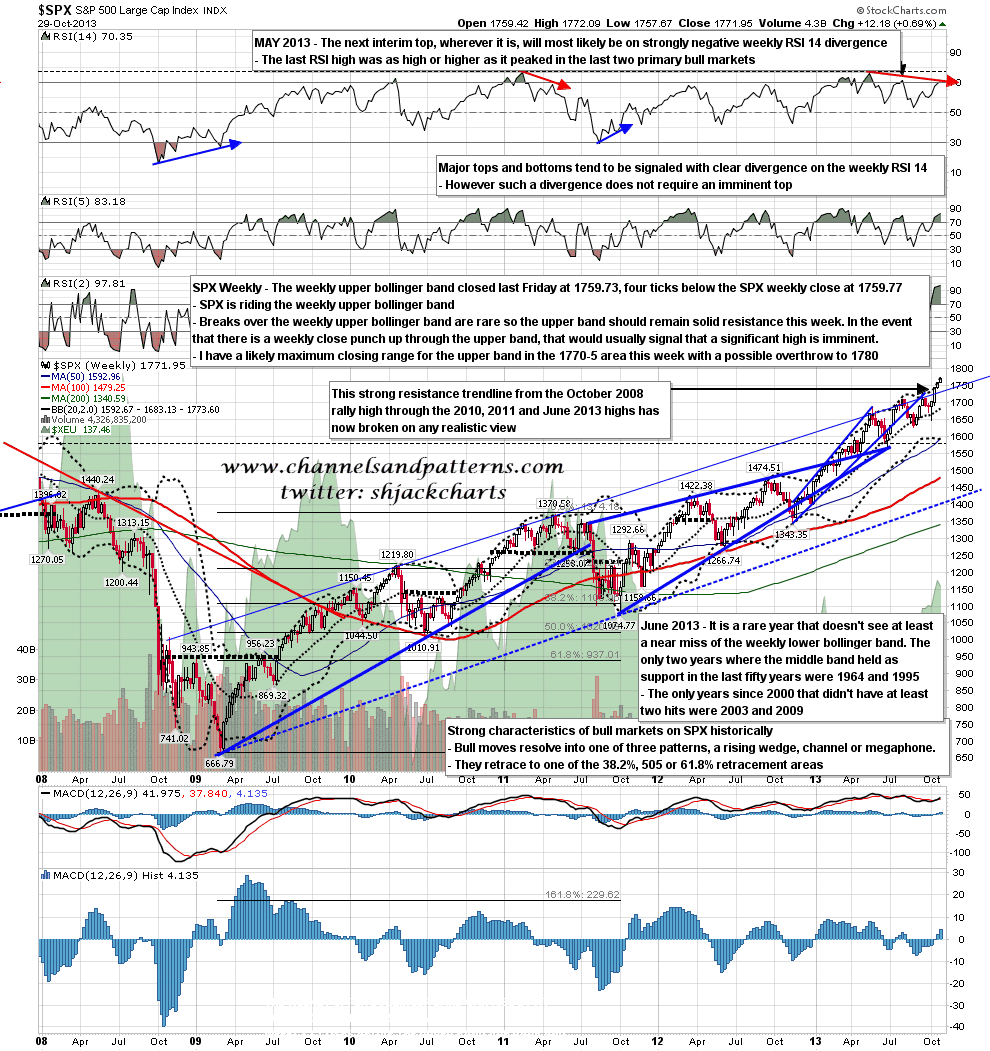
On the weekly chart SPX closed in the likely 1770-5 maximum closing area, with lower probability spill to 1780, that I gave on Monday morning based on the likely closing level of the weekly upper bollinger band this week. SPX could punch above of course, but if that punch persists into the weekly close this week that would generally be a strong signal of a high that would be both imminent and more significant than anything that I am expecting to see here. SPX weekly chart:
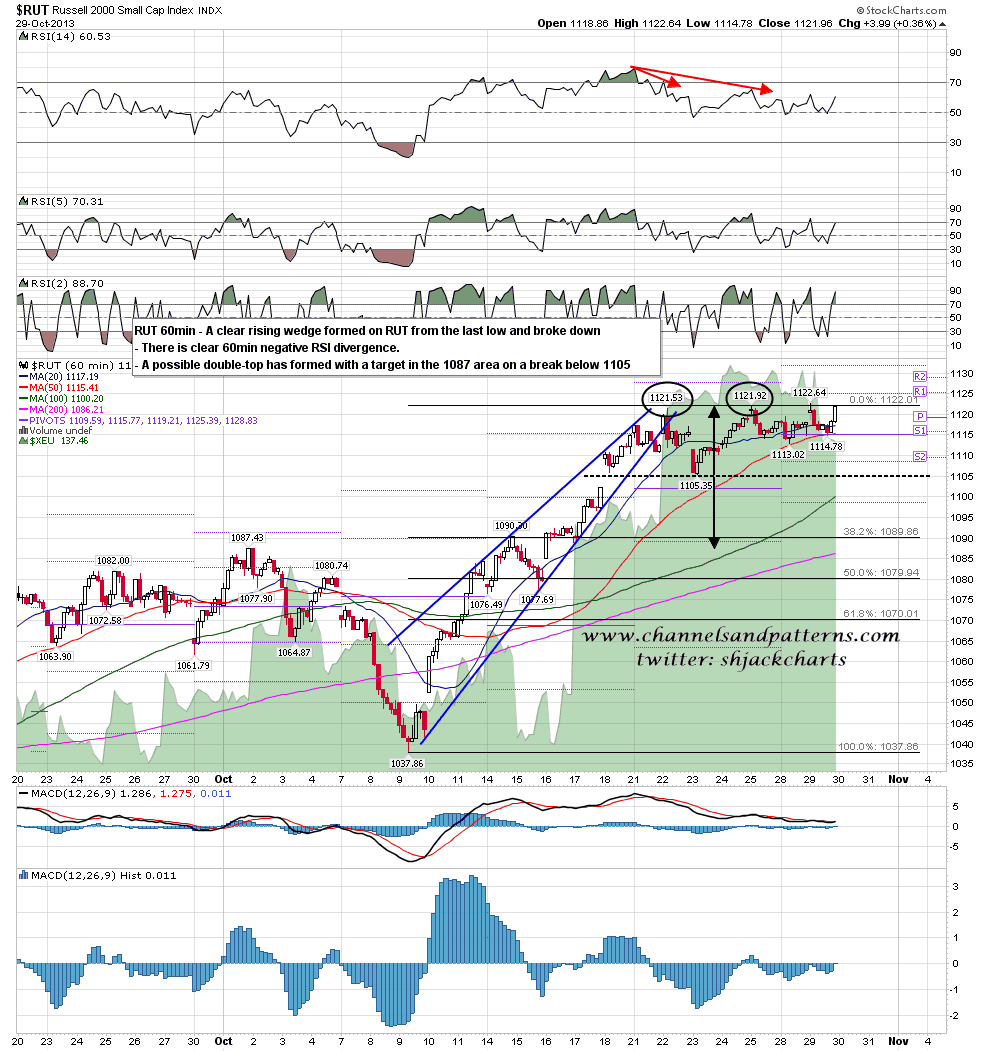
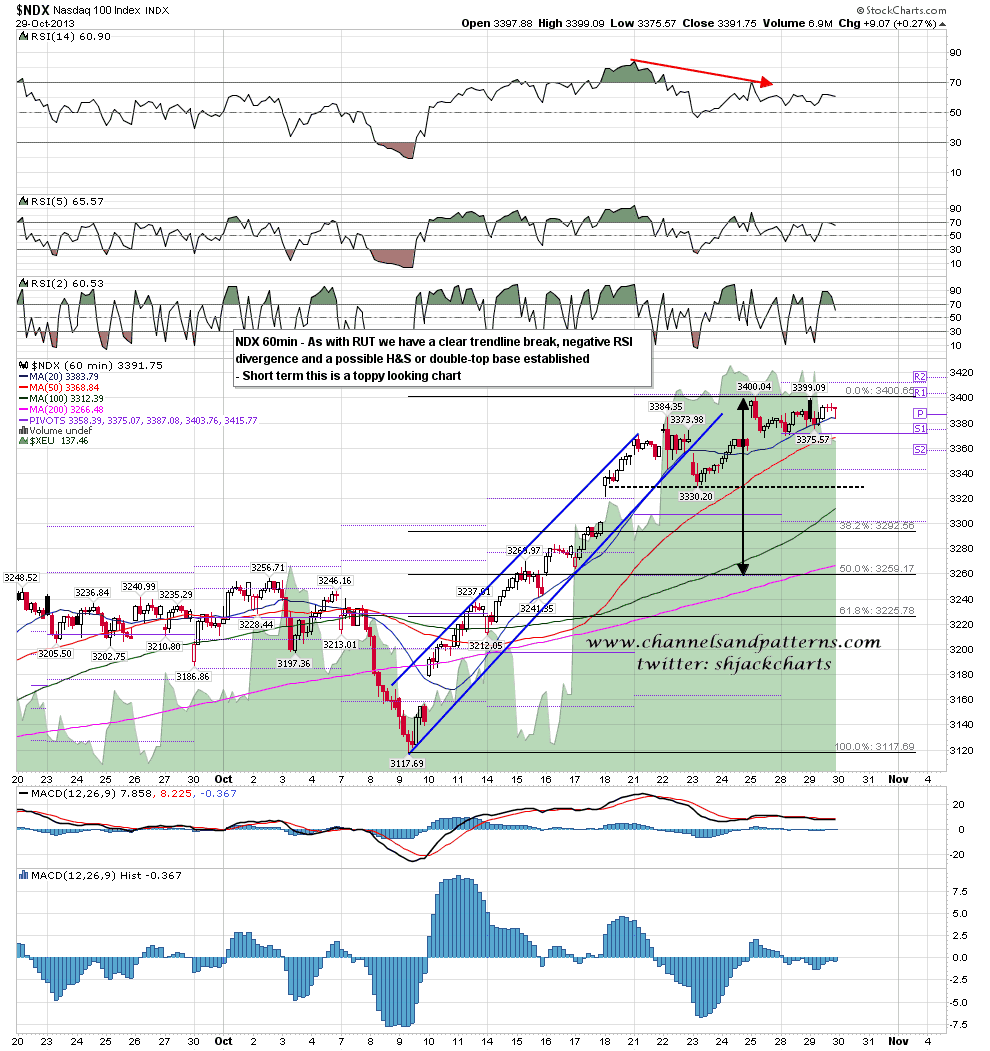
I posted the RUT and NDX charts yesterday morning and will post them again today as neither made a significant new high yesterday, stalled at obviously significant levels on both. If we see a very strong spike up today we might see a resistance break with follow-through action at these resistance levels and I’ll also be watching for a possible gap up over these resistance levels at the open, in which case I would be considering the possibility of breakaway gaps until those gaps were filled. RUT 60min chart:
NDX 60min chart:
We shall see what the mad munchkins at the Fed have in store for us today. Subject to that I’m leaning cautiously short. My apologies for the late post today, I’ve had a very busy morning offline.
