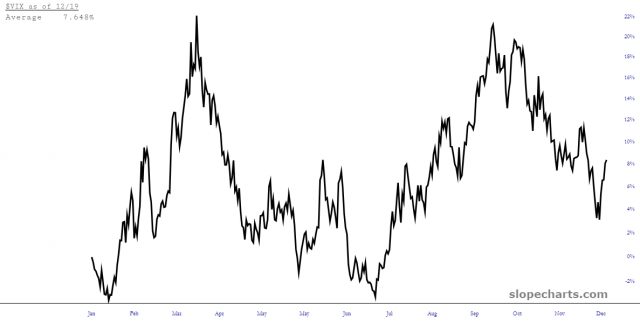
Here’s an interesting chart I created with the Time Perspective mode in SlopeCharts. It shows, on average, what the VIX does over the course of a typical year. Please note the nadir of this is in a few weeks.


Here’s an interesting chart I created with the Time Perspective mode in SlopeCharts. It shows, on average, what the VIX does over the course of a typical year. Please note the nadir of this is in a few weeks.
