
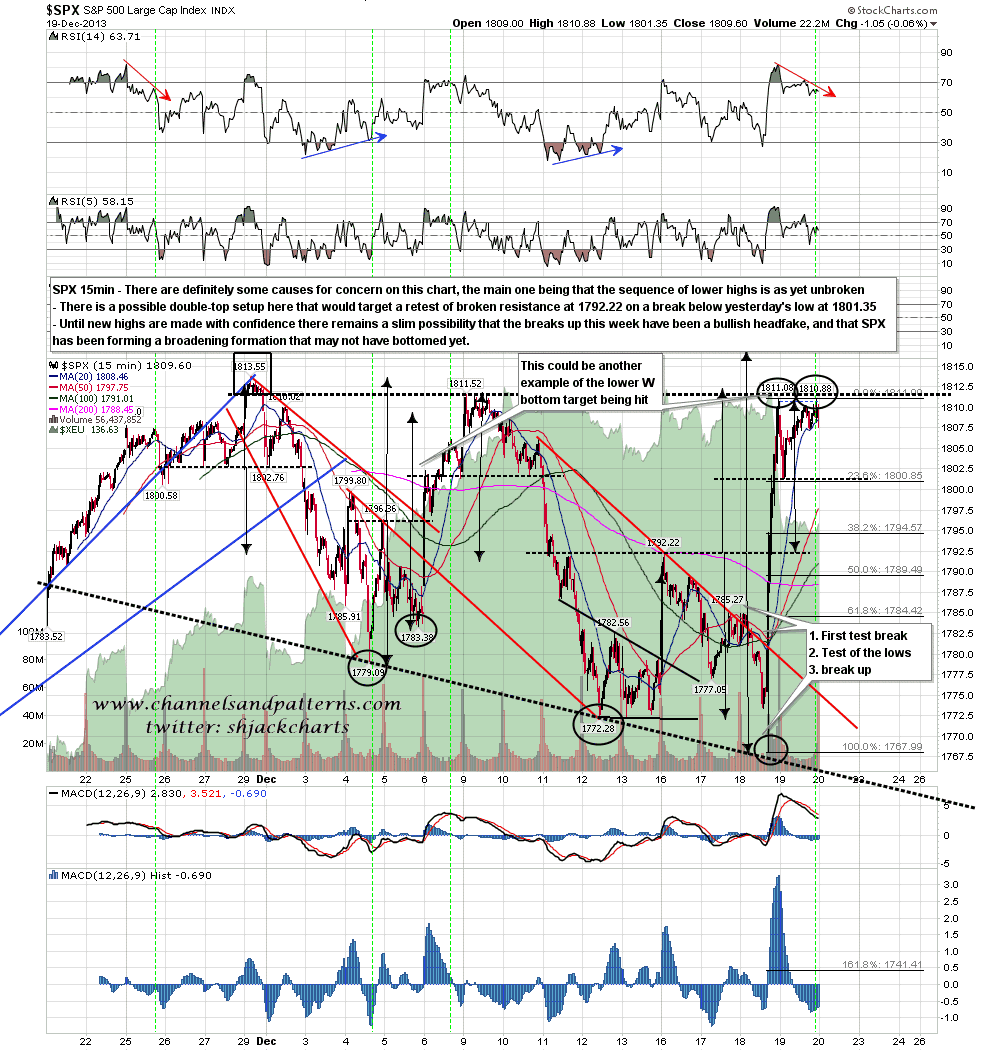
I was going to post the chart below on twitter last night but became dispirited and went to bed after my main computer crashed for the eighth time. I was showing the possible double-top setup on SPX that was forming yesterday as SPX was repeatedly failing to make a new high. This setup might break down today to retest broken double-bottom resistance at 1792.22. My overall lean for the rest of December is bullish but this needs to be borne in mind today. SPX 15min chart:
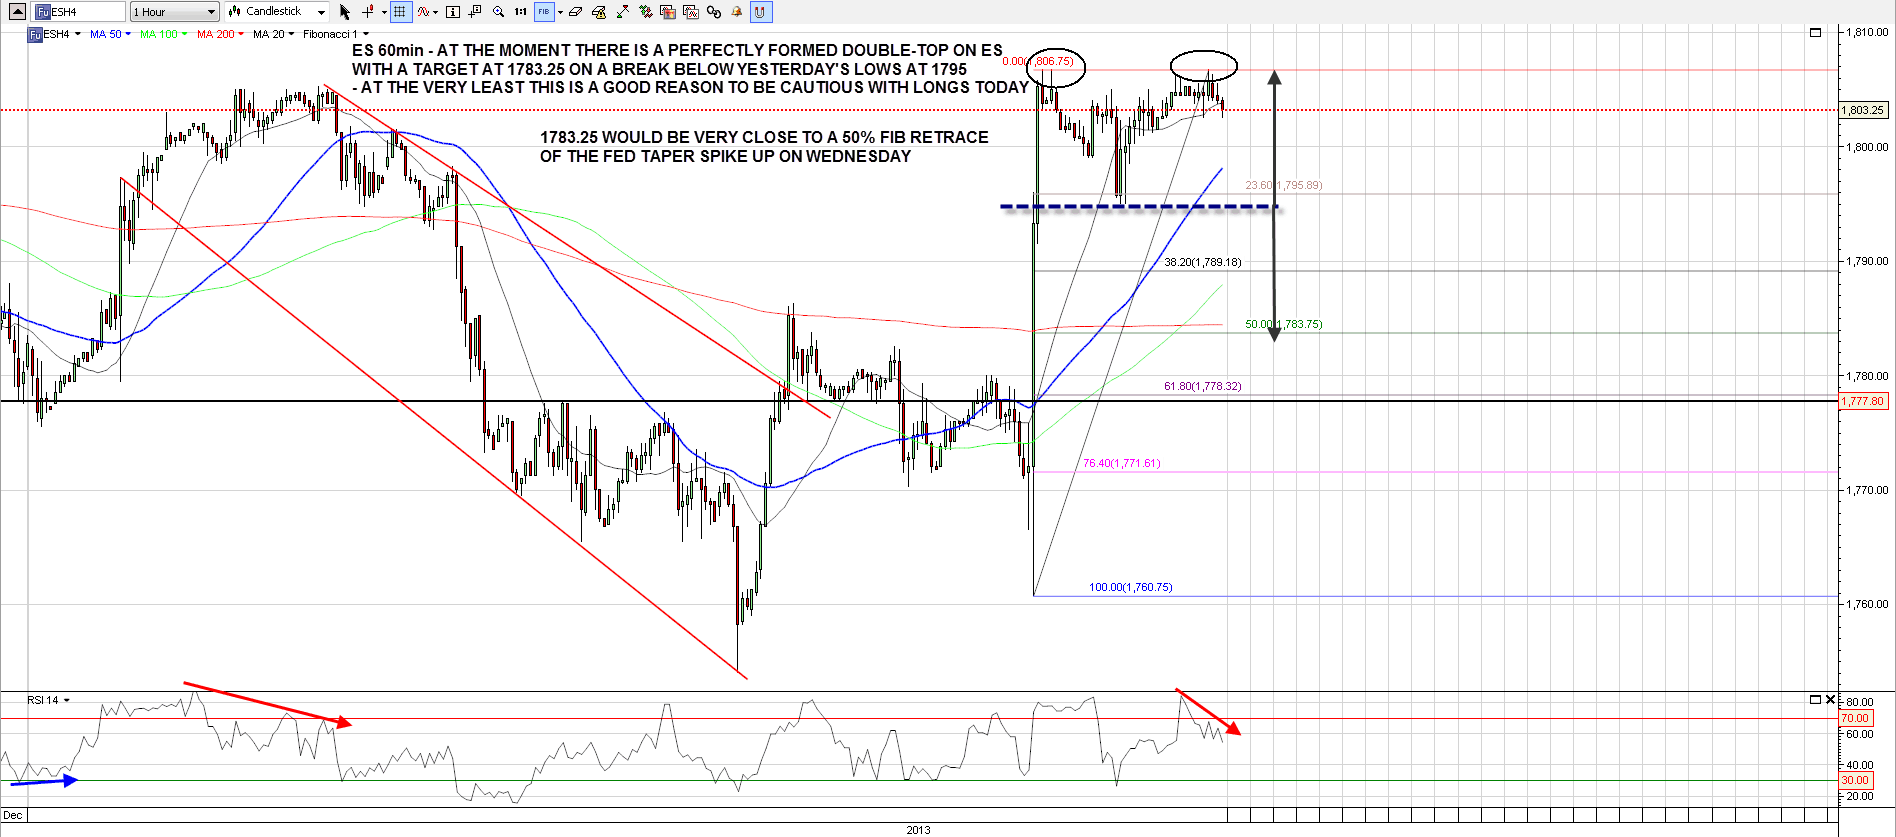
When I was looking at the charts this morning I saw that there was now also a perfect possible double-top setup on the ES 60min chart, supported by negative RSI divergence. At the very minimum this is good reason to be cautious on the long side today, but on a break below 1795 the target would be 1783.25, very close to a 50% retrace of Wednesday’s Fed Taper Spike. ES 60min chart:
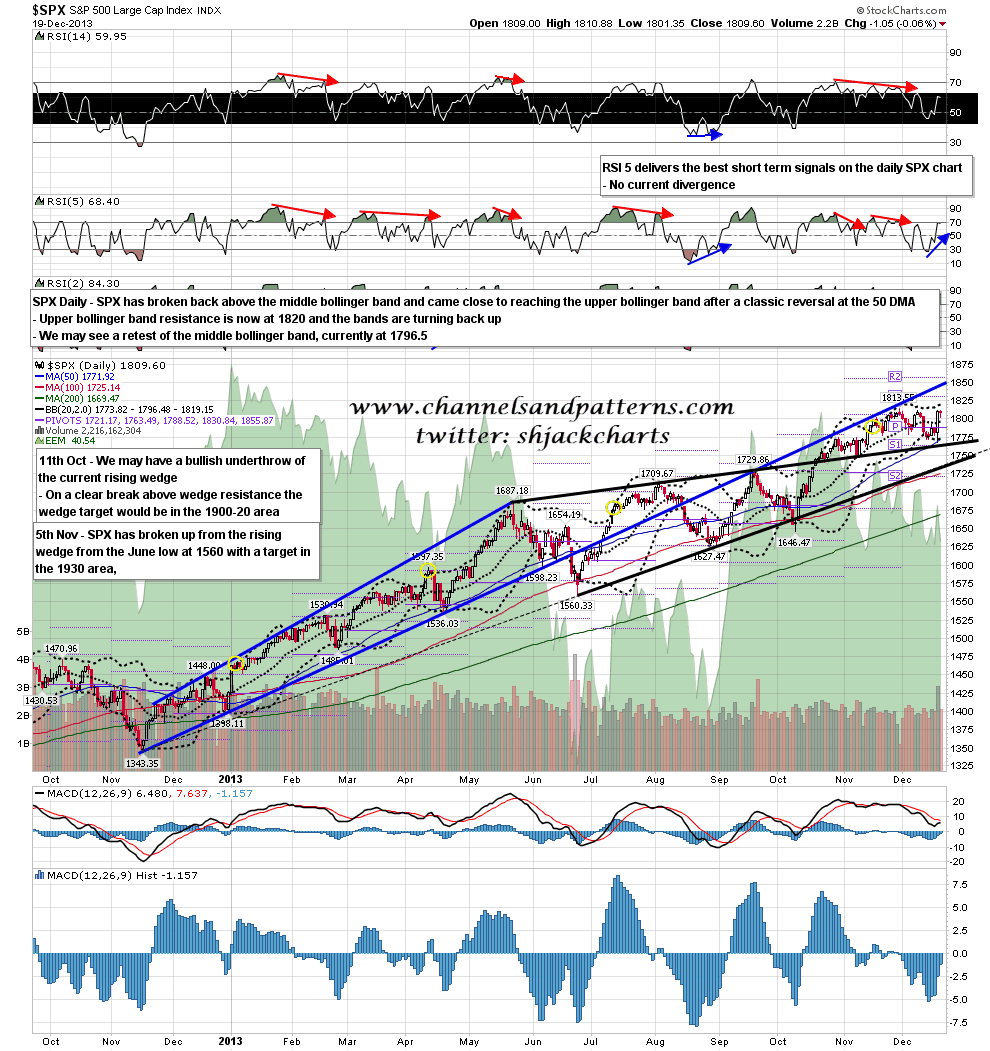
It wouldn’t be unusual top see a retest of the SPX daily middle bollinger band at this stage, and that closed at 1796.5 SPX yesterday. An intraday spike down through it could easily deliver the obvious targets on the SPX and ES charts above, as those are in the 1789.5 to 1792.5 SPX area. SPX daily chart:
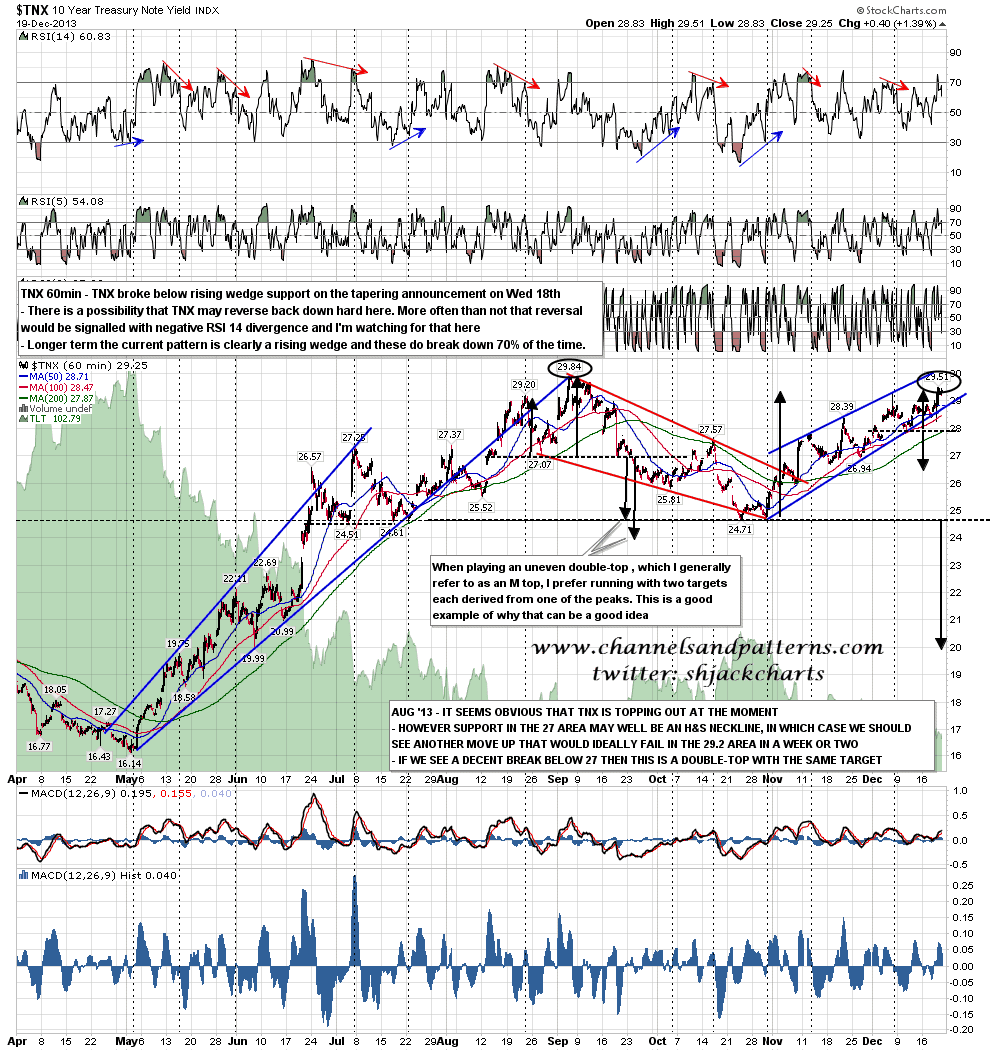
I’m still leaning bullish on bond yields, but I was laying out a possibly very bearish scenario there yesterday. I have this on possible reversal watch and will be posting this chart every day or two until TNX breaks up or down from this inflection point. TNX 60min chart:
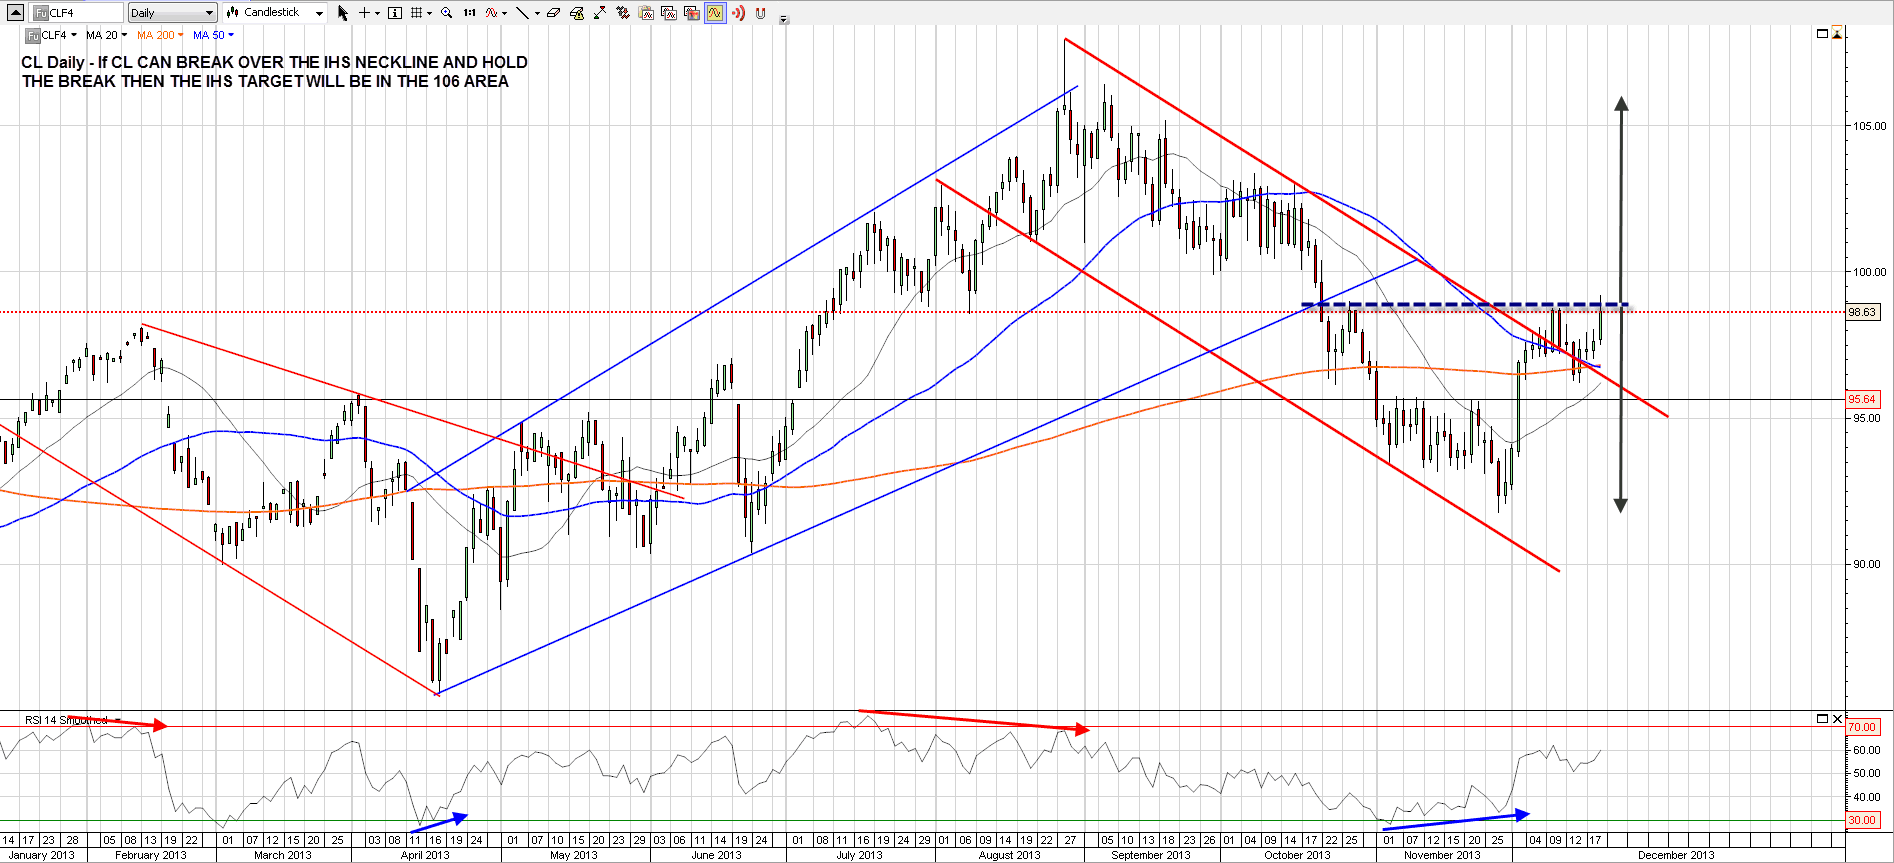
When CL first reached 97 on this rally I sketched out the possible IHS that might form at a 97 neckline and that IHS is now fully formed and has been testing the neckline. On a daily close above the neckline I have the IHS target in the 106 area. CL daily chart:
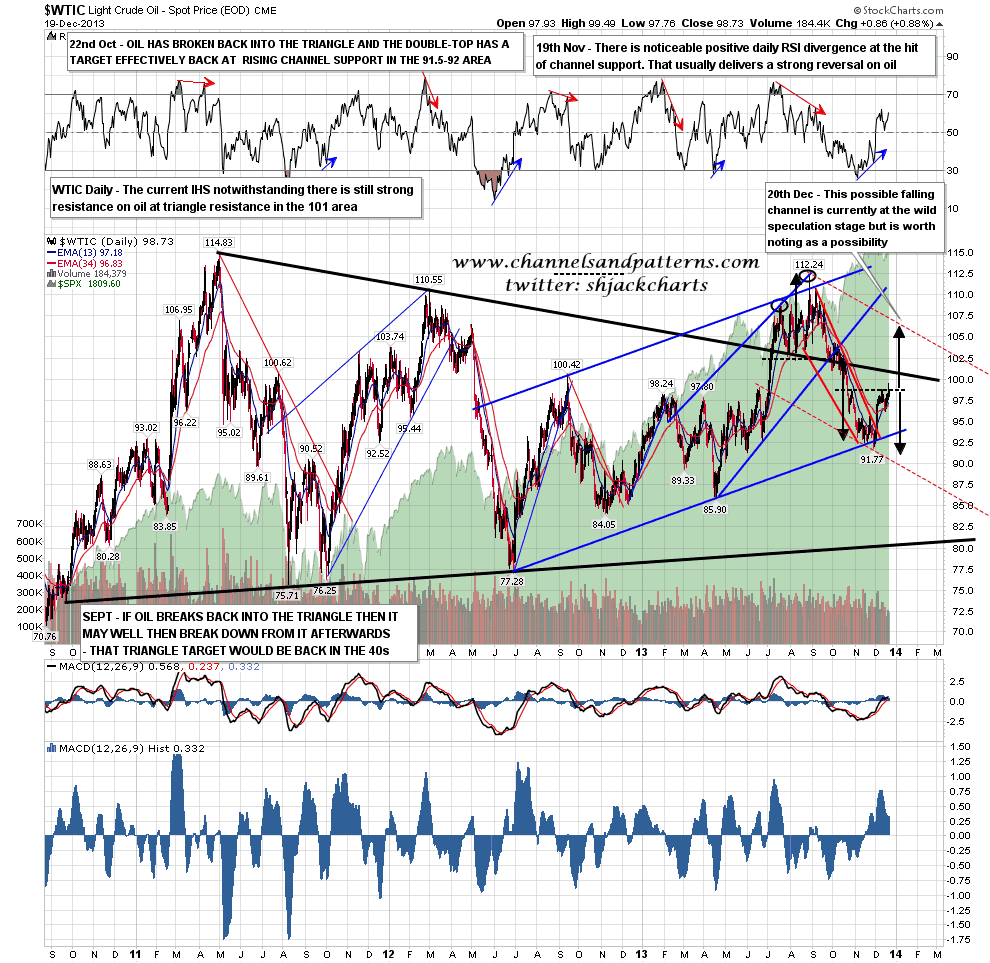
On the bigger picture however there is some significant resistance at the three year triangle resistance in the 101 area and that might hold. If oil should break back above that however I have sketched in a currently extremely speculative falling channel that might be forming. WTIC daily chart:
Bulls should be concerned about any move below 1800 ES this morning, and on a break below 1795 we might well see those double-tops play out today. If that happens the close will be interesting as a close on or above the SPX middle bollinger band would lean bullish, and a close more than 2 points below would remind us that despite the bullish action this week SPX is still in a cycle of lower highs and lows that it has so far failed to break. That will no longer be a concern if SPX can push up over 1811.52 near the open today.
This is a simply beautiful short term bear setup but …….. the GDP number was decent, seasonality is bullish, participation today is likely to be low, and it’s been a while since the bears have reliably been able to find their car keys. We may just break straight up to new highs instead. At the least though there is good reason to be careful with longs today.
