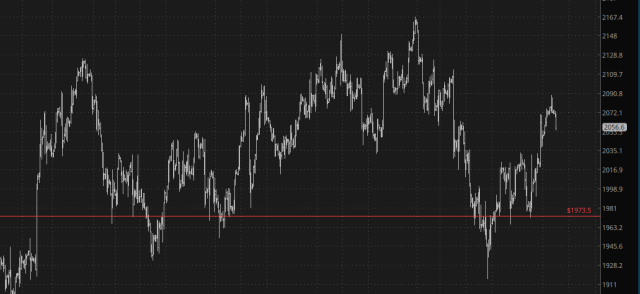
It feels like I haven’t woken up to any red quotes in months but, amazingly, ES, NQ, and RTY are all my favorite color. Below we see the 5-minute bar chart of /ES which has been on a relentless tear since Jerome “I’m here for the common man” Powell jacked up the market by trillions a week ago. The permabulls at ZH are probably distressed that their overlord, Goldman Sachs, is having a very brief period of being wrong.

The longer-term chart of /ES shows we’re still between two major Fibonacci levels. The portion above the red line isn’t a very clean top at all, but it’ll have to do for now.

The /NQ, whose minute bars are shown below, is also taking a nice bit of selling. This week is bone-dry in terms of economic data and earnings report (unless quarterly data from Toyota rocks your world), so I guess there’s no particular reason for this weakness except that stocks are insanely overvalued.

The most interesting equity future remains the small caps, whose /RTY has been meandering for literally months. It keeps oscillating between fantasy (ascending market) and reality (descending market) without really making a firm decision either way.

I don’t have a penny of buying power left, so I’ll just sit tight for now.

