
I was checking out the probability of reversal for the three main US indices today after the close:
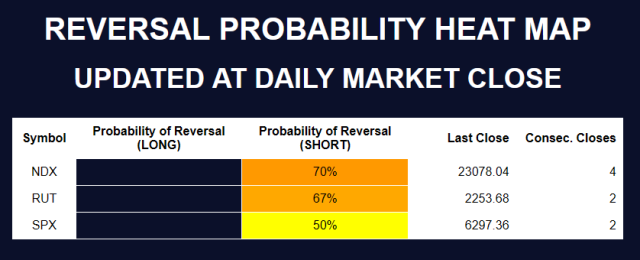
The NDX stands out as the most probable candidate for a pullback on Friday.
SPX and RUT may follow through but you never know, there have been quite a lot of discordance moments between these 3 indices as of lately.
Before I continue with my analysis of the NDX probability (below), I was wondering if you guys would find helpful a sort of “DAILY” commentary where I could track these 3 indices and other markets I follow, feel free to comment under the post, let me know what you think, I understand this stuff may be hard to digest if you have to use it alone by yourself without any guidance, maybe a written DAILY commentary would be easier to follow and actionate? Curious to hear your thoughts on this.
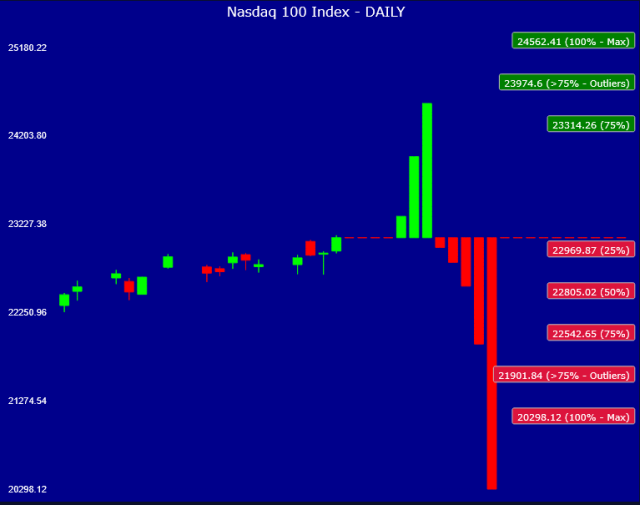
Now, onto the NDX, here below we can see the QUANTCHART, showing target prices for rallies (green color) and pullbacks (red color), and the probability of trend reversal once these targets are reached.
The next profit target is 23314, it has 75% probability of reversal, it is not super-far, it could be reached on Friday if the NDX rallies.
The first support for pullbacks are at 22969 and 22805, prob. of reversal from 25% to 50%. If the NDX stays in bullish mode these are the supports from where it will bounce again.
These numbers are all calculated based on analysis of historical DAILY trend patterns that match the current trend pattern, all the past behaviors have been captured and analyzed to predict what could happen again at the present time.
There are various ways to trade this information: options are probably the best choice, in particular Vertical Spreads or simple CALLs/PUTs.
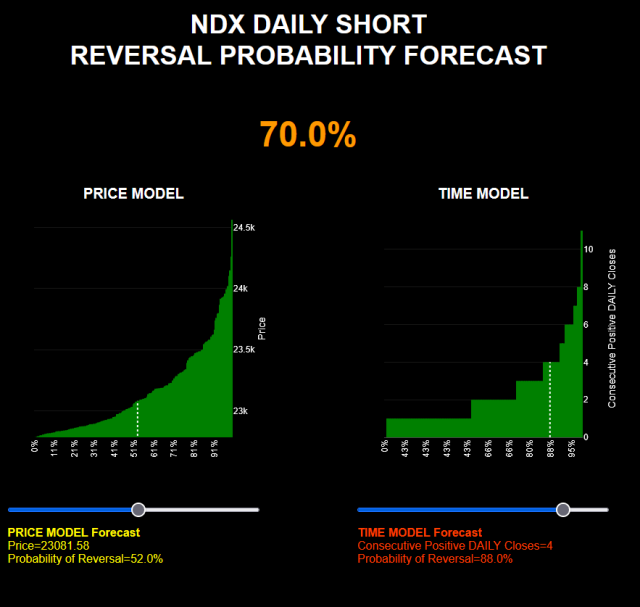
Here below we can see the current scenario: the NDX is reaching the next resistance at 23081. The probability of reversal is low, 52%, even though the index has been moving higher for 4 consecutive day.
I read this as BEARISH behavior, it’s going higher without convinction, it could pull back soon.
The time model, to the right of the graph, counts how many times the index reversed after x days up, when this pattern was encountered in the past (i.e. this is not a generic study, it is pattern-specific).
Now, the NDX has closed up 4 days in a row, probability of reversal is 88%, it’s very overbought according to our DAILY time model.
Combined probability of reversal price+time model = 70%.
Conclusion: nothing is sure in finance, but I see a good probability that the NDX pulls back and closes in negative territory on Friday.
If you want to get direct access to these tools, you can use this link.
Use ‘SLOPEOFHOPE’ coupon to get a perpetual 30% discount on the monthly access cost.
