
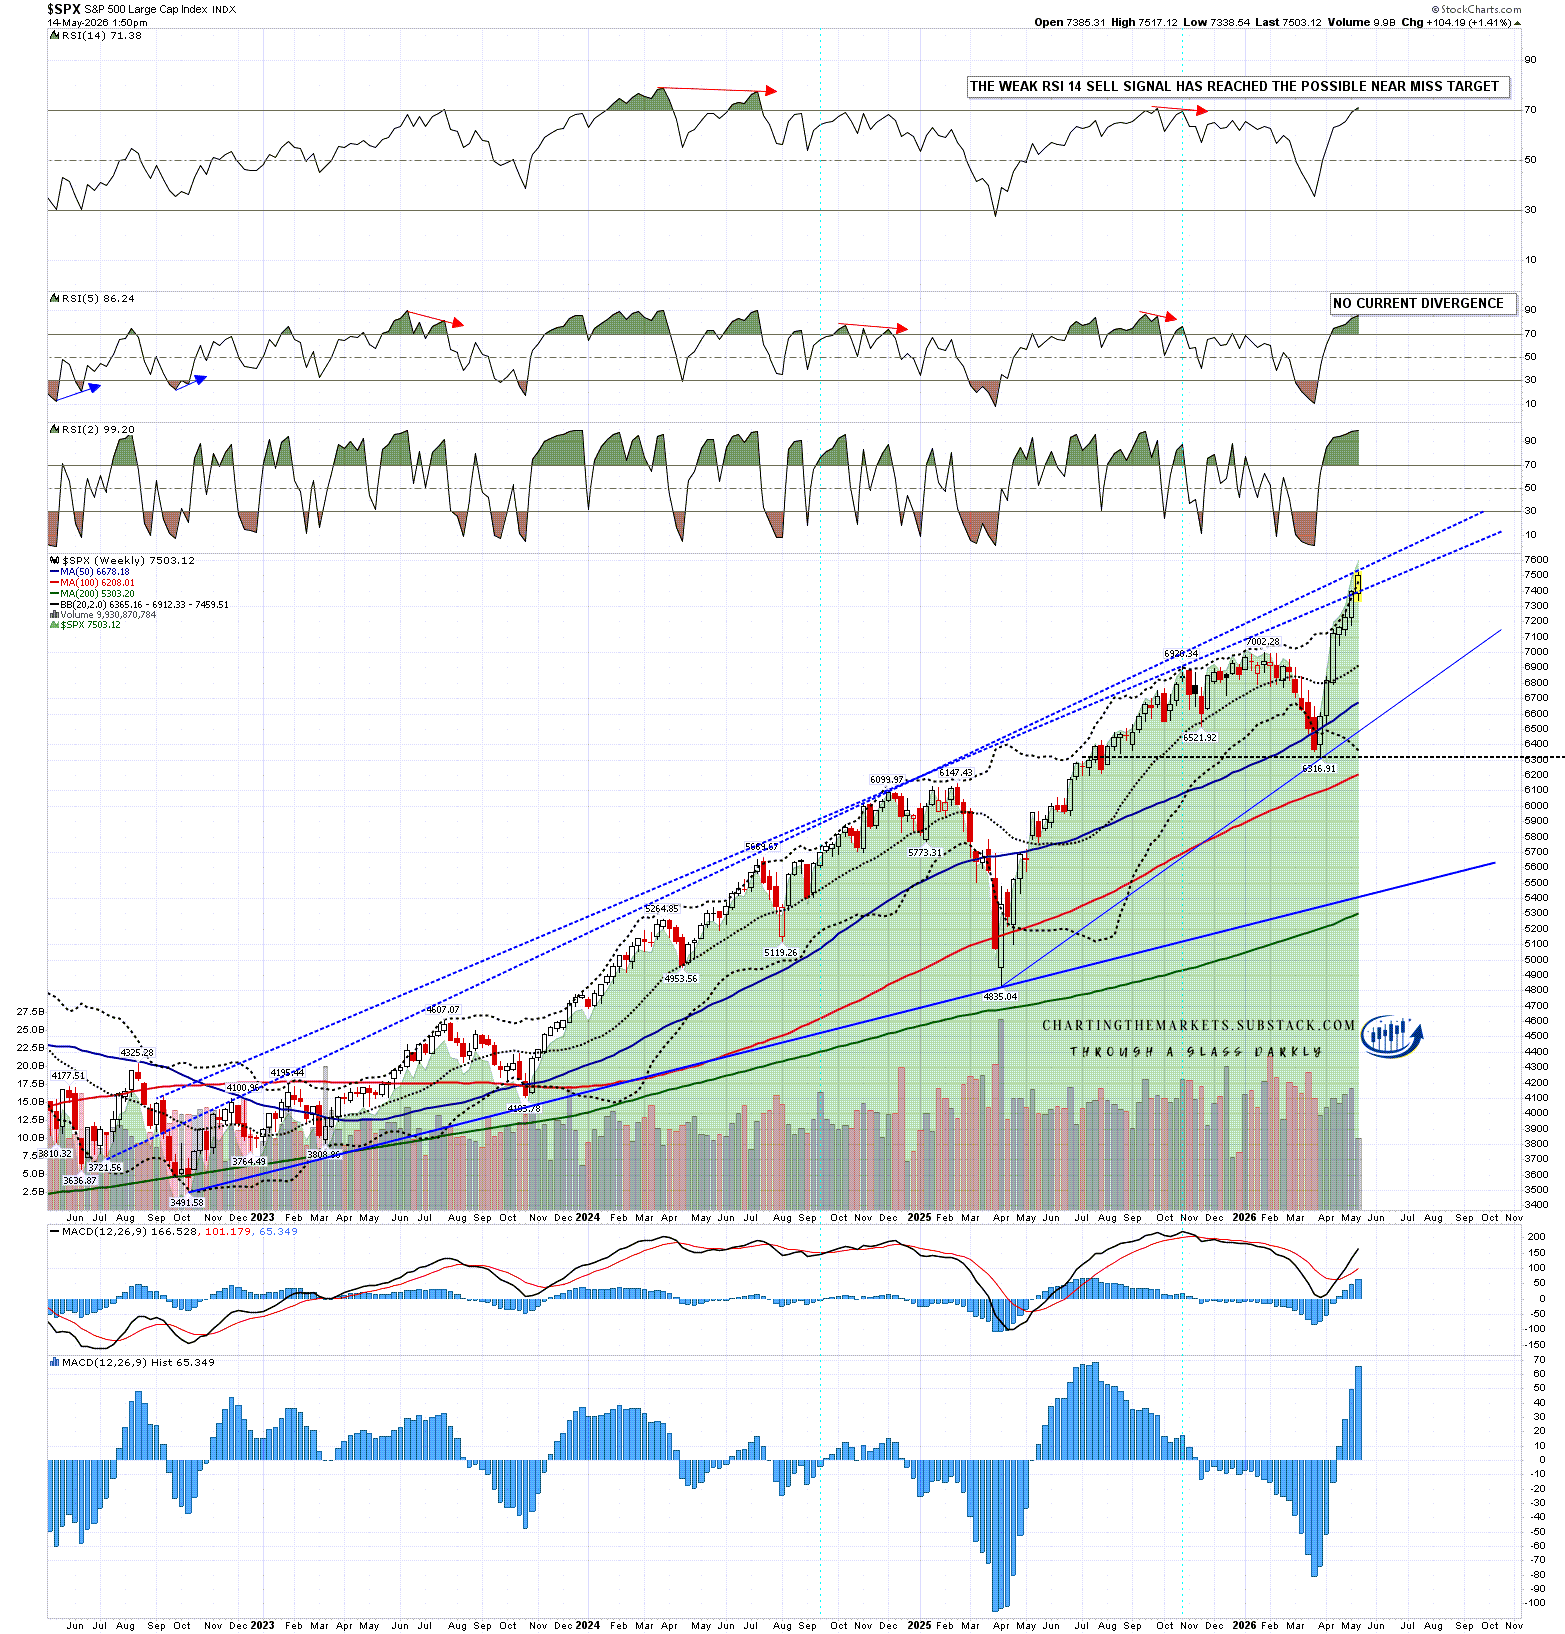
In my post on 28th April I was talking about the Hormuz crisis but noting that when SPX made a new all time high on 19th February 2020, well after it was so obvious that COVID-19 was going to be a big problem that panic hoarders had caused a worldwide shortage of toilet paper, it reached a major resistance trendline and I was speculating that we might see that again here, giving a trendline target 200 handles higher in the 7360 area.
In my last post on 6th May I was looking at the resistance trendline again on the SPX weekly chart and that rising trendline was being close to being hit in the 7385 to 7400 area. It has since been hit and exceeded in what might be a bearish overthrow, but a have also since drawn in an alternate high-quality resistance trendline that is being hit today. SPX could go a bit higher, but the obvious upside trendline targets have now been hit.
SPX weekly chart:
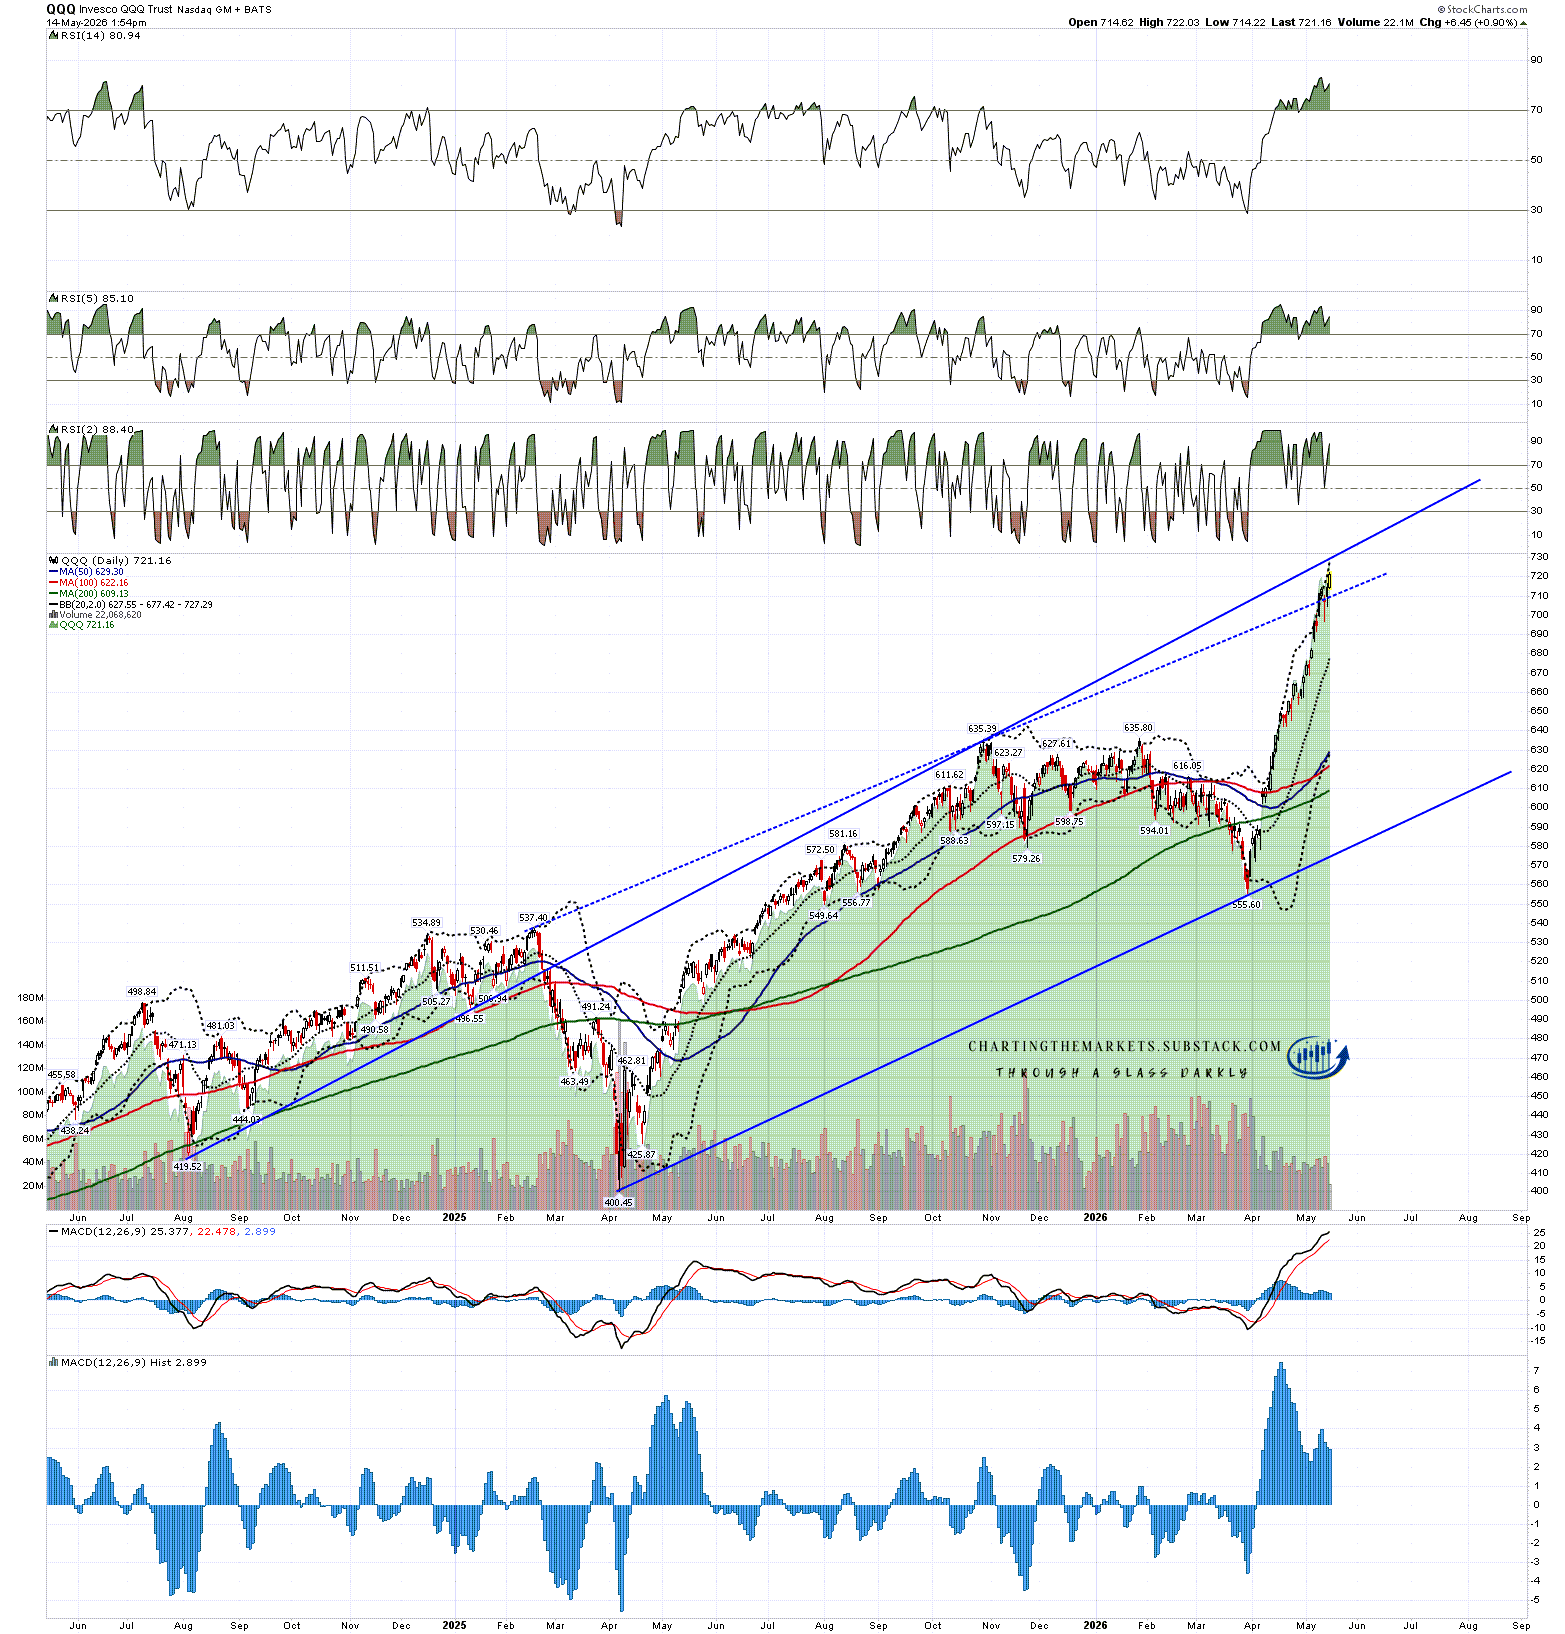
On QQQ I was looking for a trendline target in the 695 area at the time of my last post and that has also been hit and exceeded, with QQQ in the 720 area at the time of writing.
I don’t have any higher targets on that weekly chart from the 2022 low but I do have a very nice possible trendline target on the daily chart from the April 2025 low. If that is hit this week it would be in the 730 area.
QQQ daily chart:
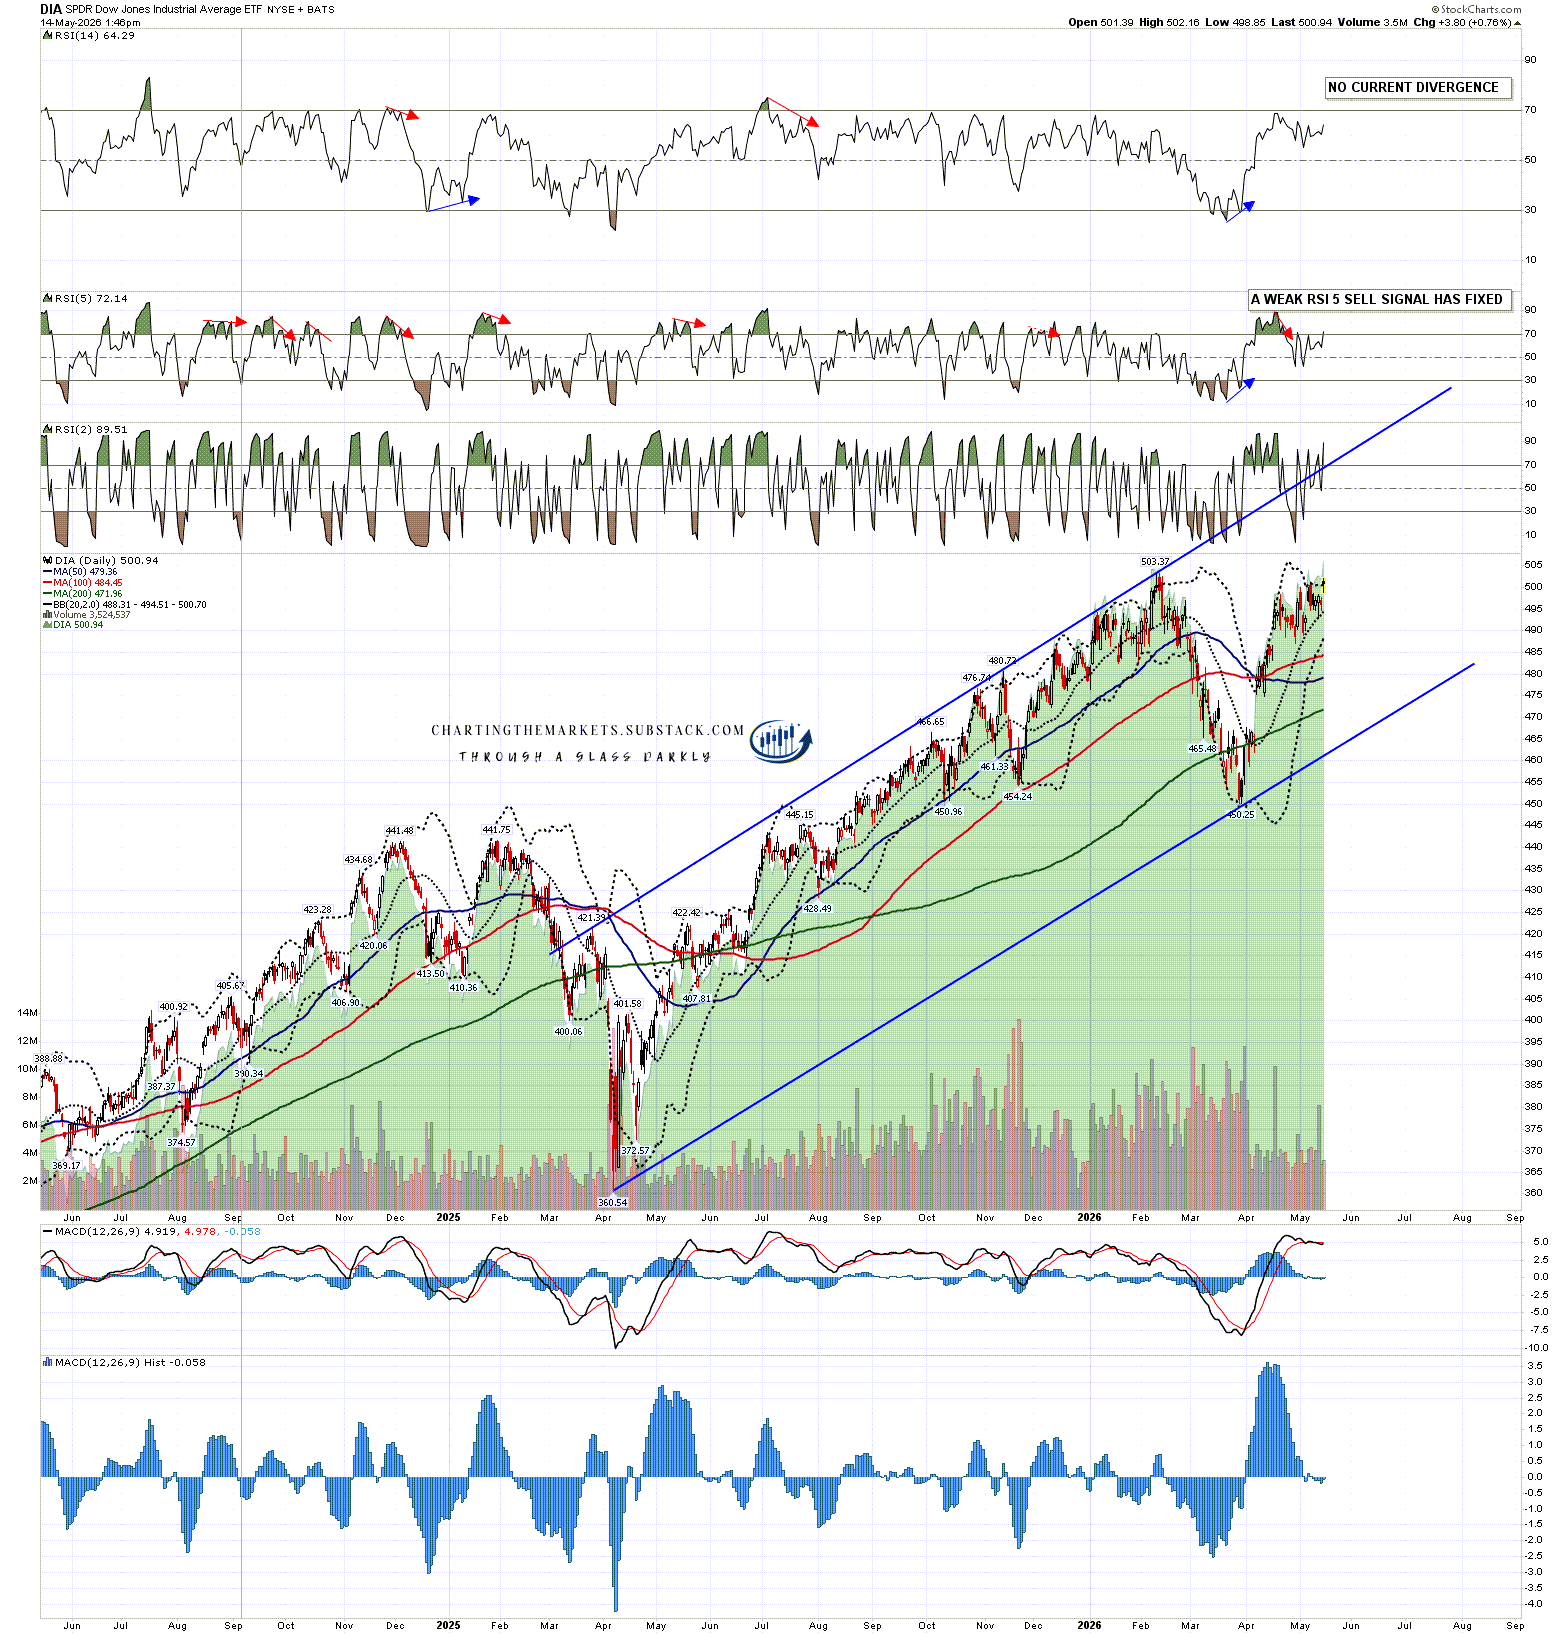
On DIA I was just looking for a retest of the all time high at 503.37 and that hasn’t quite happened, though the high so far today at 502.16 is very close. I’m leaning towards seeing that hit before the high for this move, ideally tomorrow or early next week.
DIA daily chart:
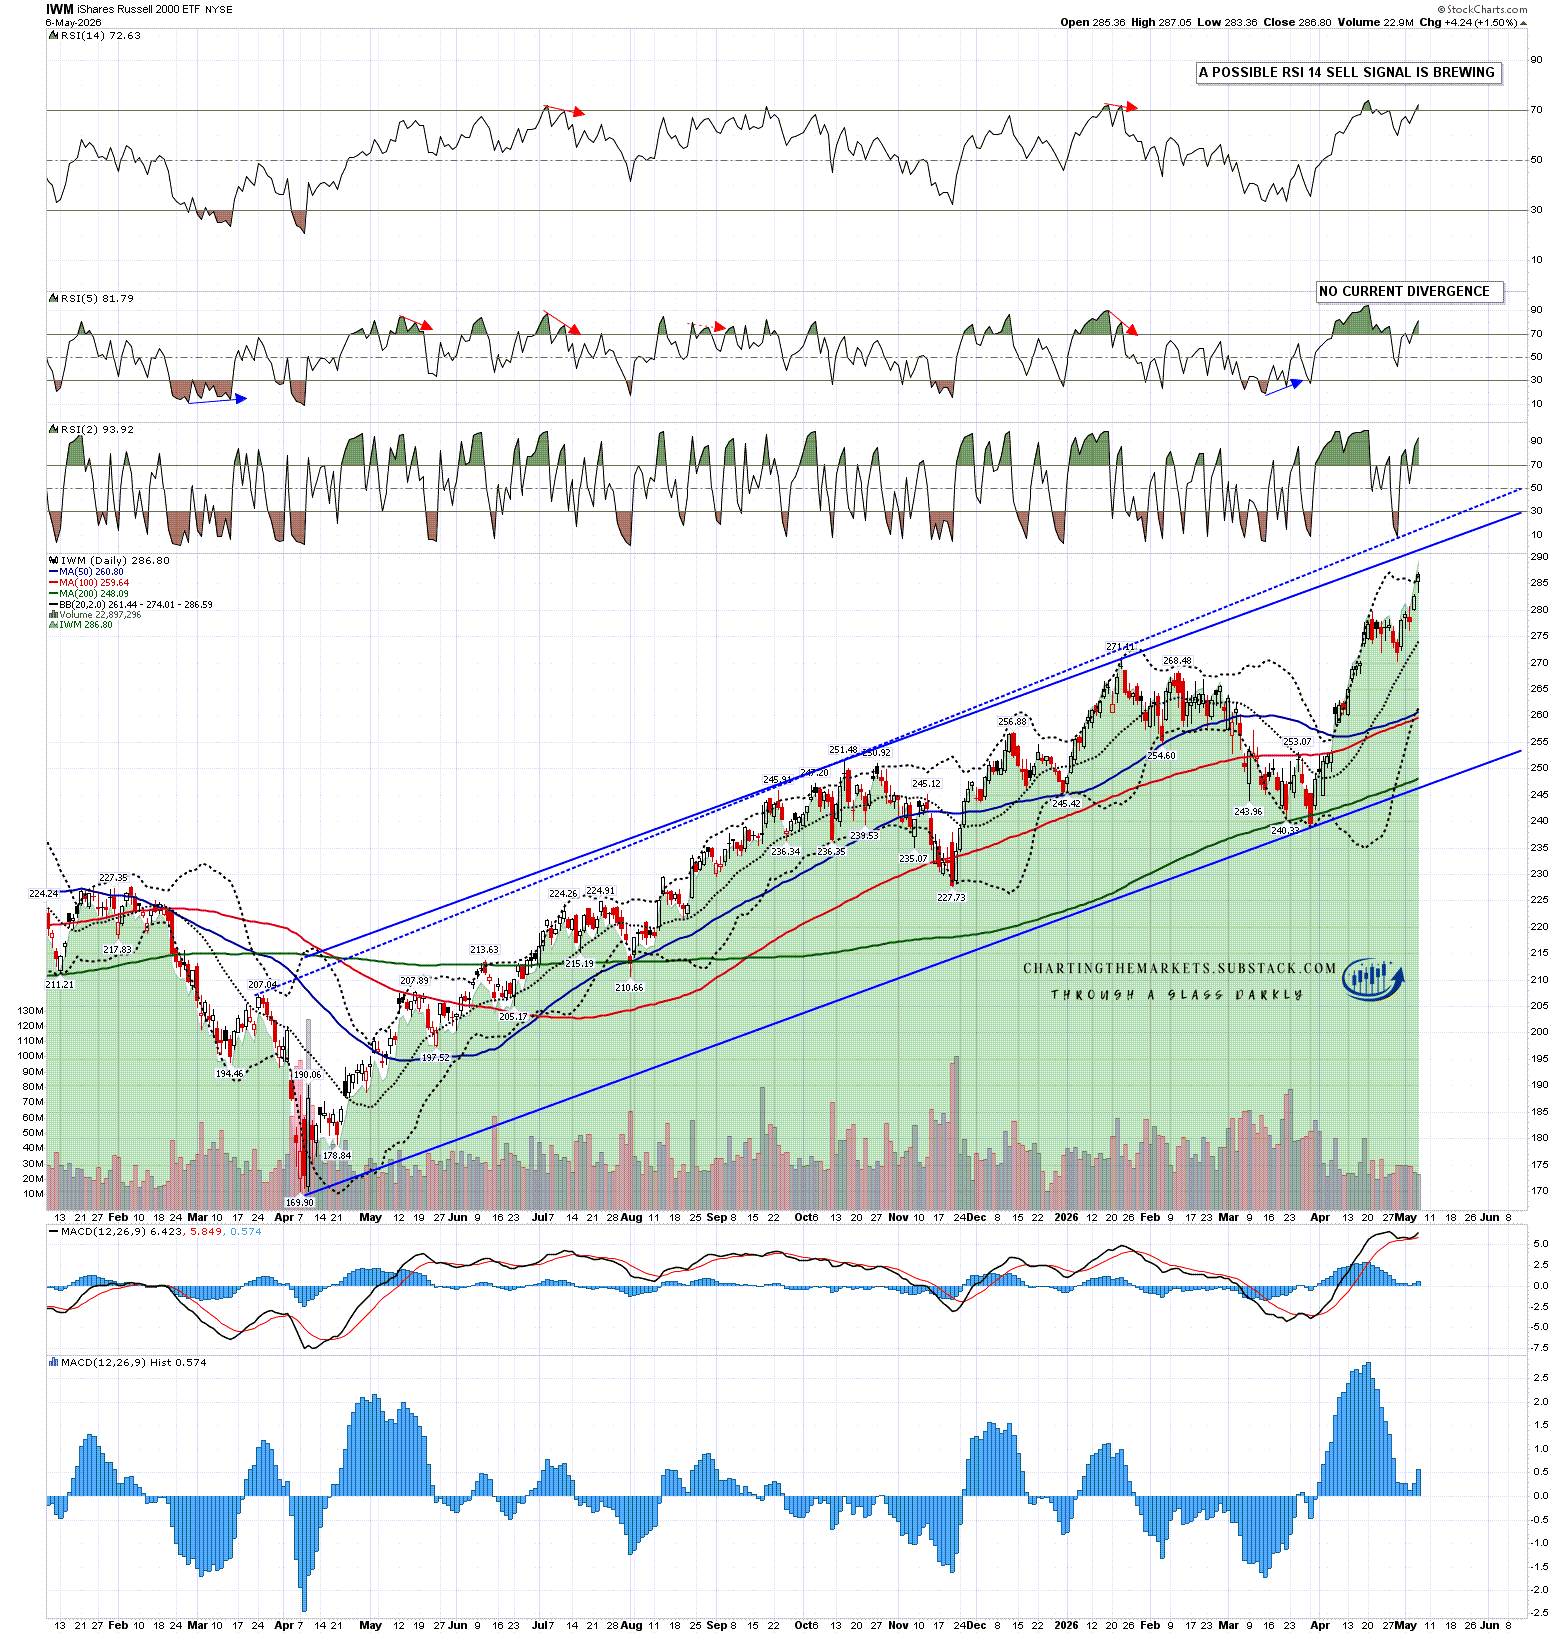
On IWM I drew two possible trendline targets that have not been hit but have since drawn in a third possibility that has. IWM doesn’t need to go any higher but I am at least expecting this high at 287.58 to be retested, as I have a nice looking bull flag on the RTY hourly chart which has broken up with a target there.
IWM daily chart:
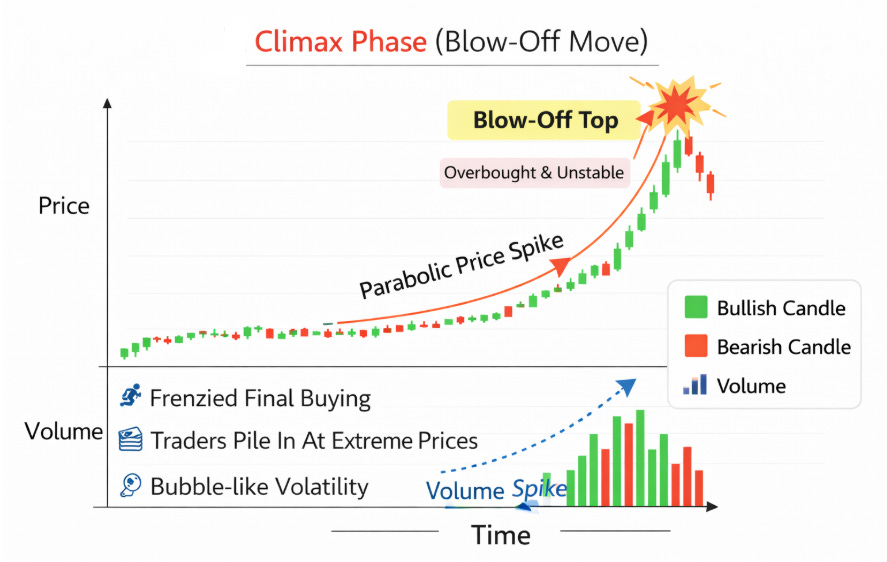
What kind of high might we see at the end of this wild run? Well this is looking very like a parabolic ending move. That would suggest a significant high:
How are things looking under the surface? Well the Strait of Hormuz has now been closed for 11 weeks and doesn’t look likely to reopen at anything like pre-war levels anytime soon. There is a likely big supply shock coming soon.
Both sides in the Iran War have been waiting for the other side to concede defeat since early April, but neither looks likely to do so. A resumption of hostilities is looking increasingly likely. Regardless of that the big supply shock from the closure of the Strait is likely coming soon.
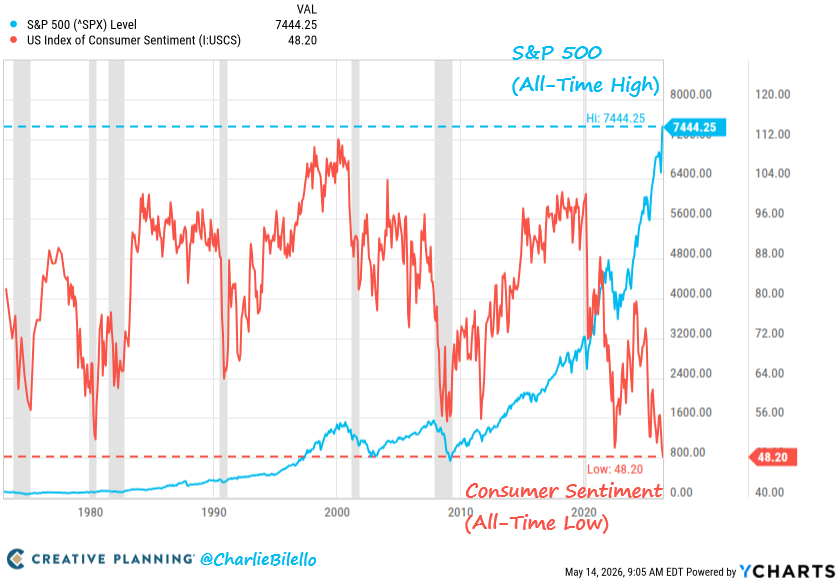
In the US inflation is rising rapidly, there is increasing evidence that US consumers are cutting back on non-gasoline expenses and the yawning chasm between the current all time highs on the S&P 500 and all time low in consumer confidence is awe-inspiring. Consumer confidence historically is a leading indicator of market declines as you can see on the chart below:
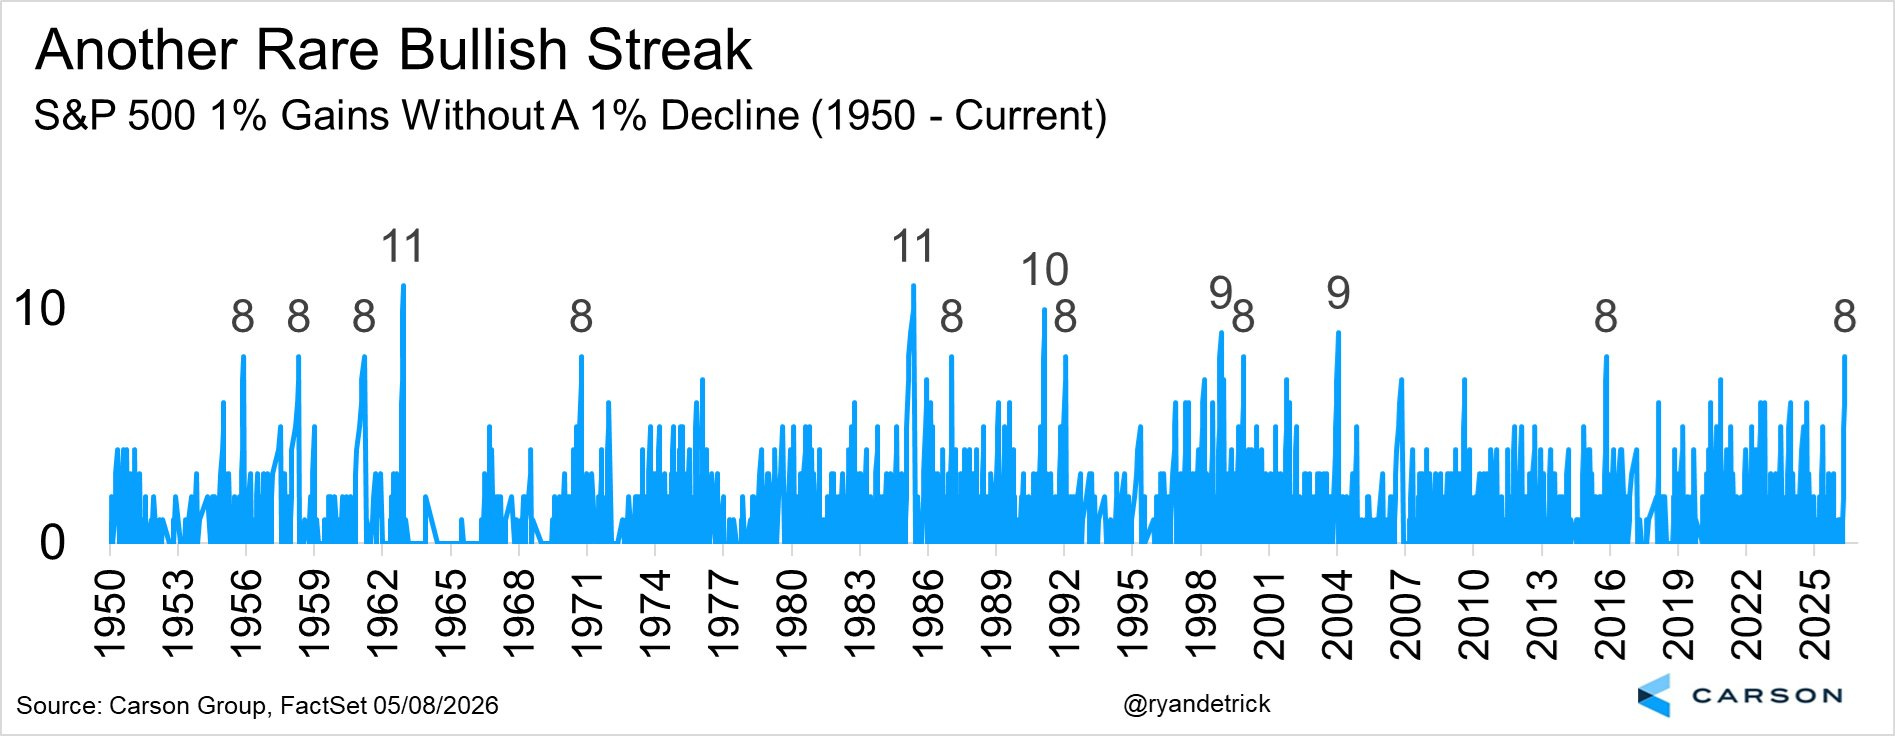
In the short term US equity indices look very stretched on many measures, but the one that caught my eye today was the number of days of SPX 1% gains without a 1% loss . That hit eight yesterday, equalling eight previous runs like this since 1950. It may hit nine today, with two previous instances since 1950. Above there are just one instance of ten and two instances of eleven. Upside from here looks limited:
At the end of April I was arguing for higher equity prices using the analog of February 2020, high quality target trendlines above, and (on my webinars) that the short term structure looked incomplete in a way that generally suggested that the move was not close to finishing.
At this point equities have hit the trendlines I was looking for and I am almost out of upside targets. I think the high for this move is close, and I think the months after that high lean strongly bullish for oil, food and inflation, and bearish for equities and US treasuries.
In my post on 30th April I made some predictions for oil, equity and bond markets over the rest of this year. Nothing has happened since to change this longer term view though it might take an extra month for US inflation to reach 5%.
- Oil – I think it is now very likely that Brent Crude and West Texas Intermediate Crude will hit new all time highs over $150 within weeks, and that we may well see prices in the $200 to $250 range within months. Gas at the US pump will likely rise into the $6 to $9 range and oil will likely be over $100 on a monthly average basis for the rest of this year.
- Bonds – US Inflation will likely go back over 5% within two months and may go over 7% by the end of the year. Ten year and thirty year Treasury yields will likely go over a key psychological level at 6% over the summer and may reach 9% before the next big high on yields is made.
- Equities – Looking at SPX I’ll be looking for at least a decline into the rising support trendline from the October 2022 low, currently in the 5400 area. On a break below I would be looking for a retest of the April 2025 low at 4835.04.
Obviously, this is a bearish take, but I have not felt this bearish about equities since summer 2008 and February 2020. There is good reason to be bearish here.
If you like my analysis and would like to see more, please take a free subscription at my chartingthemarkets substack, where I publish these posts first. I also do a premarket video every day on equity indices, bonds, currencies, energies, precious commodities and other commodities at 8.45am EST, but only for paying subscribers. Other places to find me are my page on the platform previously known as twitter, and my YouTube channel.
