
There was an interesting comment made to me yesterday that the shooting down of the Malaysian Airlines flight over Ukraine helped the bears considerably, and that’s true, up to a point. It is something I have noticed regularly before at big inflection points, and it’s obviously not the case that the patterns can somehow see into the future. I think there is a relationship there but logically it must be that if there is a strong bear setup like this, then the right news trigger will set the ball rolling with an apparent reaction to the news that is disproportionately larger than the reaction you might see to similar news at other times. We’ve all seen the markets shrug off bad news many times before, but when there are decent bear setups in play the market is showing a willingness to reverse that any bad news can then set strongly in motion.
Obviously the investigation into the extent that Moscow was responsible for this very avoidable tragedy is just getting started, and we may well see more geopolitical shockwaves from this in current days, though it’s important to keep this in proportion. No war is likely to start due to this tragedy, and it’s even possible that it may act as a catalyst to end the current Russian insurgency in Ukraine.
We’ve really had some great volatility this week. Yesterday was the most volatile day yet with a big gap down, a big gap fill that recovered +15 from the ES overnight lows, and then a plunge down to break the daily middle bollinger band at the close. Obviously the stat I’ve been following for the last week is very much in play here and the target for that stat is the 1949-53 ES area at the test of the last low and the daily lower band, to be hit today or on Monday. That level has been tested on ES overnight, but the target needs to be hit in regular trading hours to satisfy the stat, so I’ll be looking for at least a retest of that low by the close on Monday. SPX daily chart:
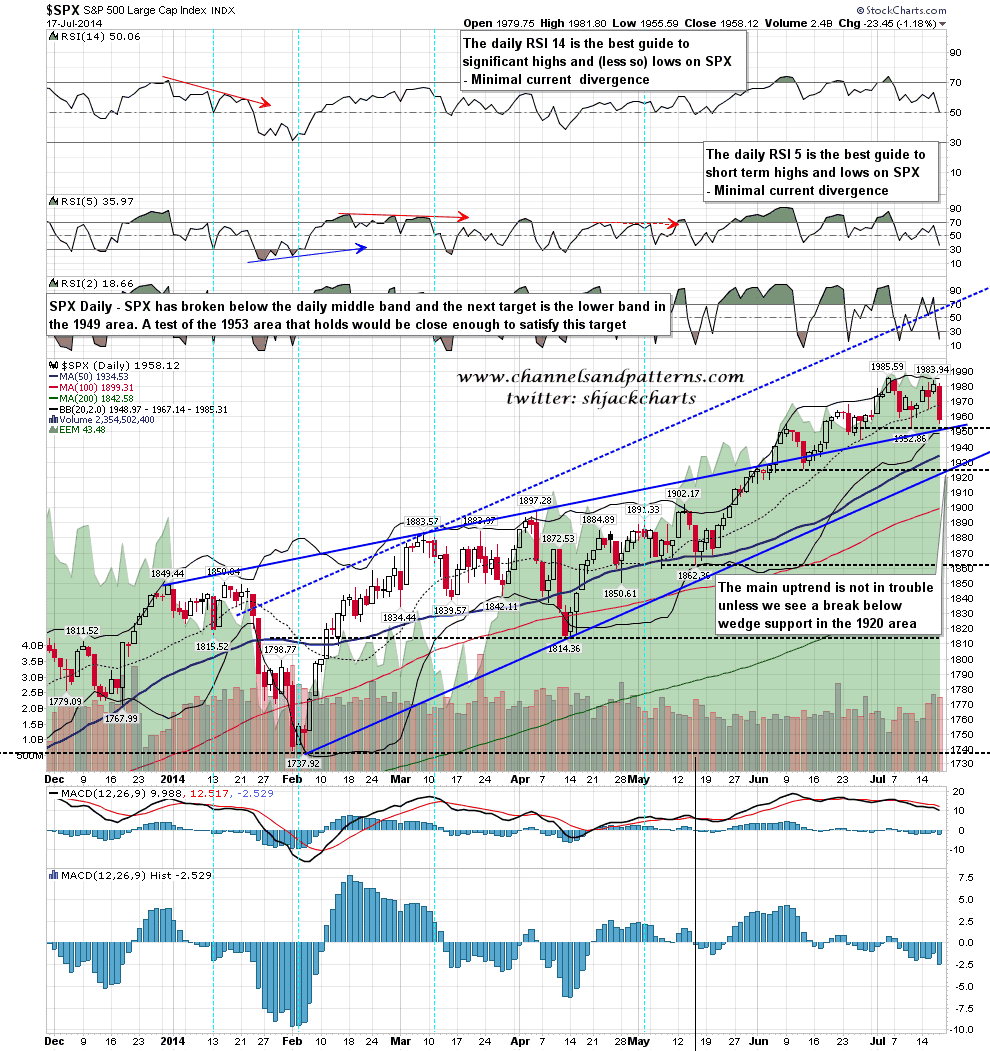
So what then? I’ve been considering this carefully, and would say first that there is impressive support at the last low at 1952. Not only is the daily lower band just below, but there is also strong trendline support both from the rising channel from the 1814 low, and also the broken rising wedge resistance trendline from the 1737 low. That is some strong support and the stat I’ve been following does not take SPX through that, as two of the three previous candles made higher lows and went directly on to new highs.
The third previous candle does provide some support, as in that case the high was the second high of a possible double (or M) top, as is the case here, and the daily lower band was at the support / trigger level for that double-top, as is also the case here. In that case the hit of the lower band broke below it and double top support to make a lower low, then there was a strong bounce before SPX went to the double top target. After that SPX reversed back up and made new highs within a few weeks.
If we are to see that happen here I’d therefore be looking for the 1952 low to be broken, as well as the SPX lower band in the 1949 area. If we see that then the double top target would be at 1919, very close to rising wedge support from 1737 low. As long as that trendline holds the overall uptrend here is not threatened. If that should break then markets might retrace a lot further. SPX 60min chart:
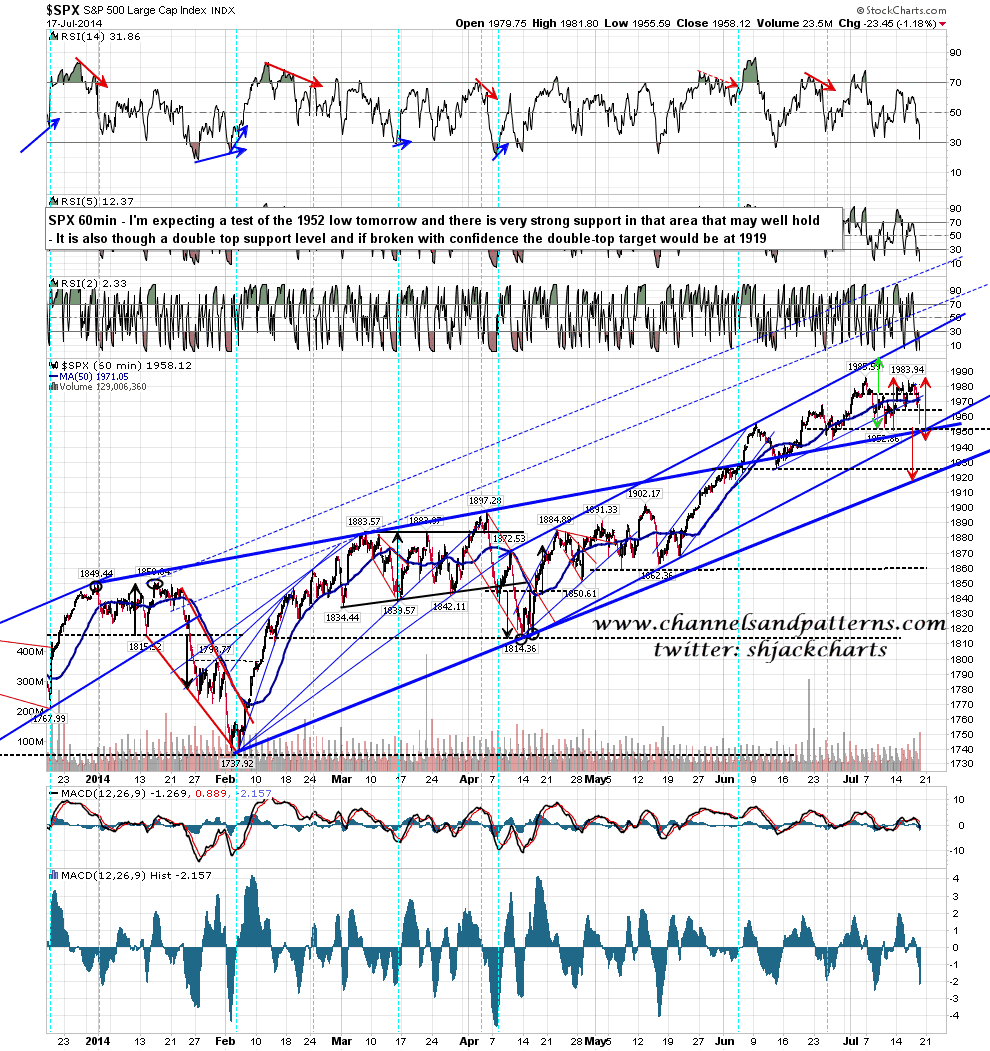
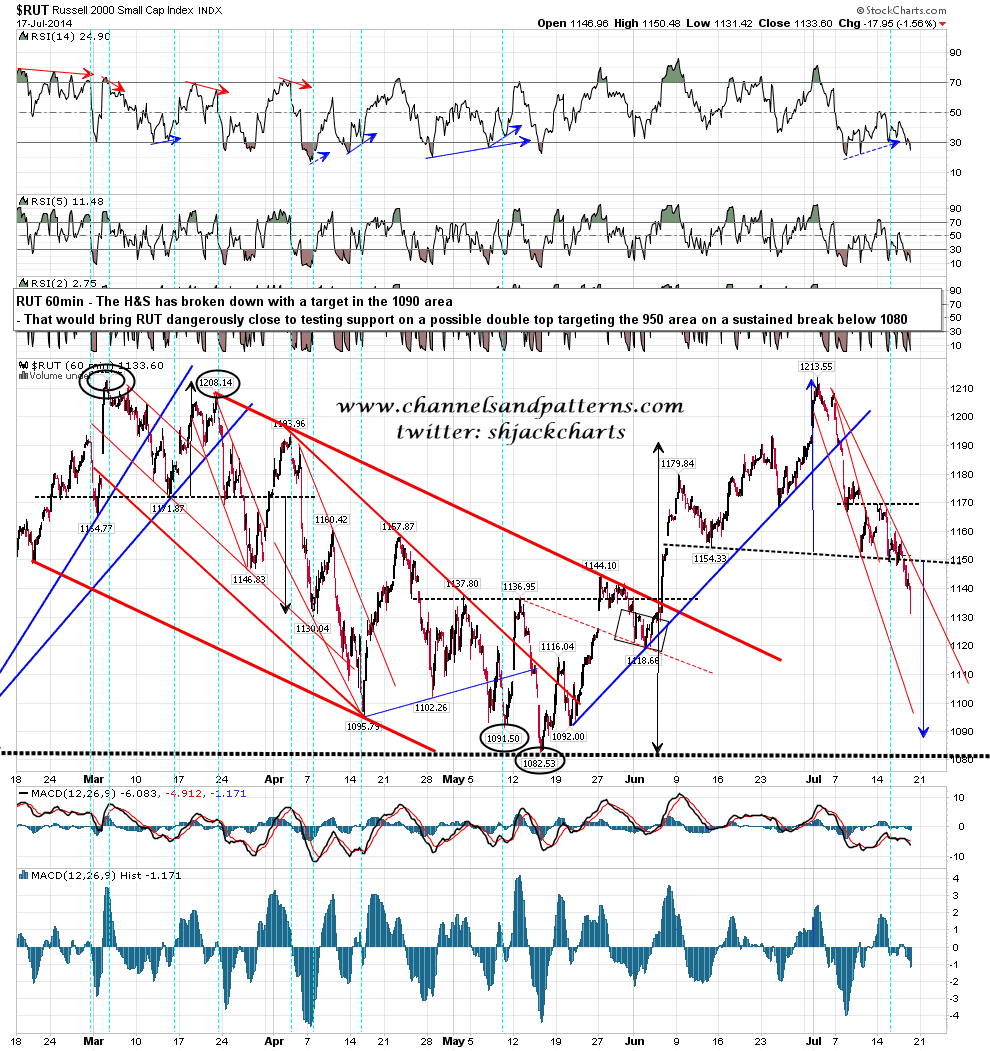
Why am I considering this possibility seriously? Mainly because the RUT H&S I have been watching broke down hard today with a target in the 1090 area, and while SPX is within striking distance of the main target, RUT clearly is nowhere near it. If this H&S on RUT plays out to target then SPX might well break down from this double top and make that target at a similar time to RUT making the H&S target. That would put both SPX and RUT near key uptrend support, which would be a strong buy as long as those levels were not broken, though in the case of RUT, that would only be a strong buy from a technical perspective, as it’s hard to get excited about buying opportunities on an index where the P/E ratio still wouldn’t have dropped below 65. RUT 60min chart:
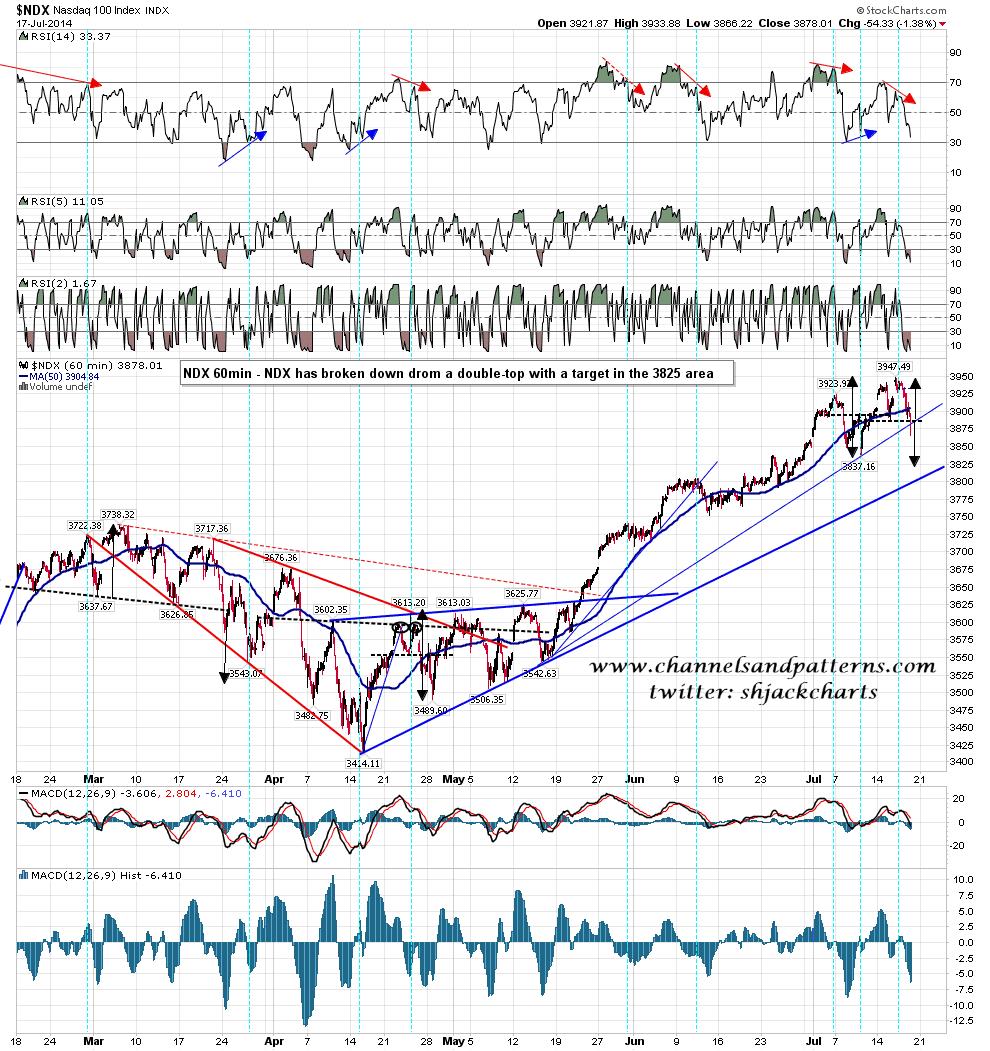
NDX is also supporting more downside, with a double top that has broken down with an effective target in the 3837 low area. That low is also double top support and on a sustained break below there the double top target would be in the 3730 area. NDX 60min chart:
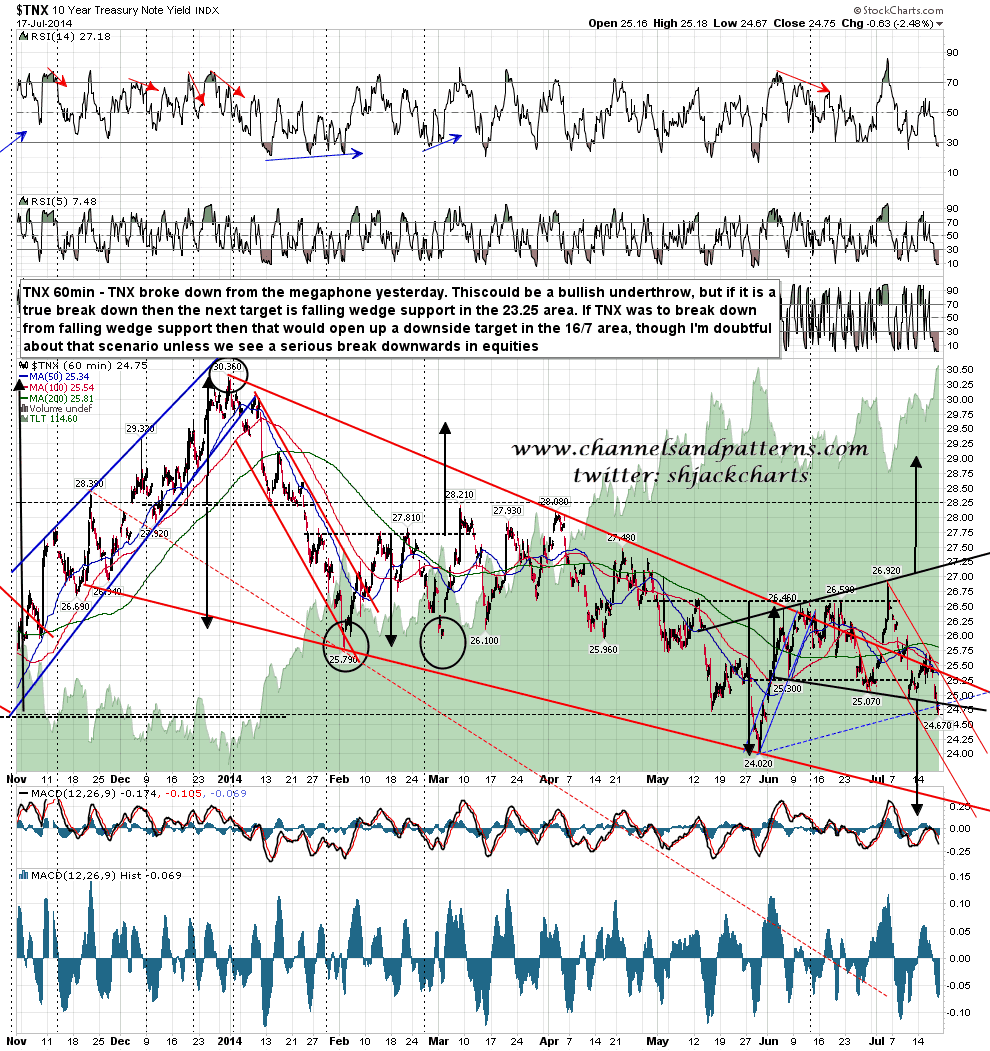
How much should one read into the moves on a big news day? Well in the past I’ve noticed that support or resistance breaks seem just as valid on big news days as on other days, so I was watching the rally on bonds with great interest yesterday. It was strong enough that TNX broke down from the current megaphone with the obvious next downside target at falling wedge support in the 23.25 area, as long as yesterday’s break holds. TNX 60min chart:
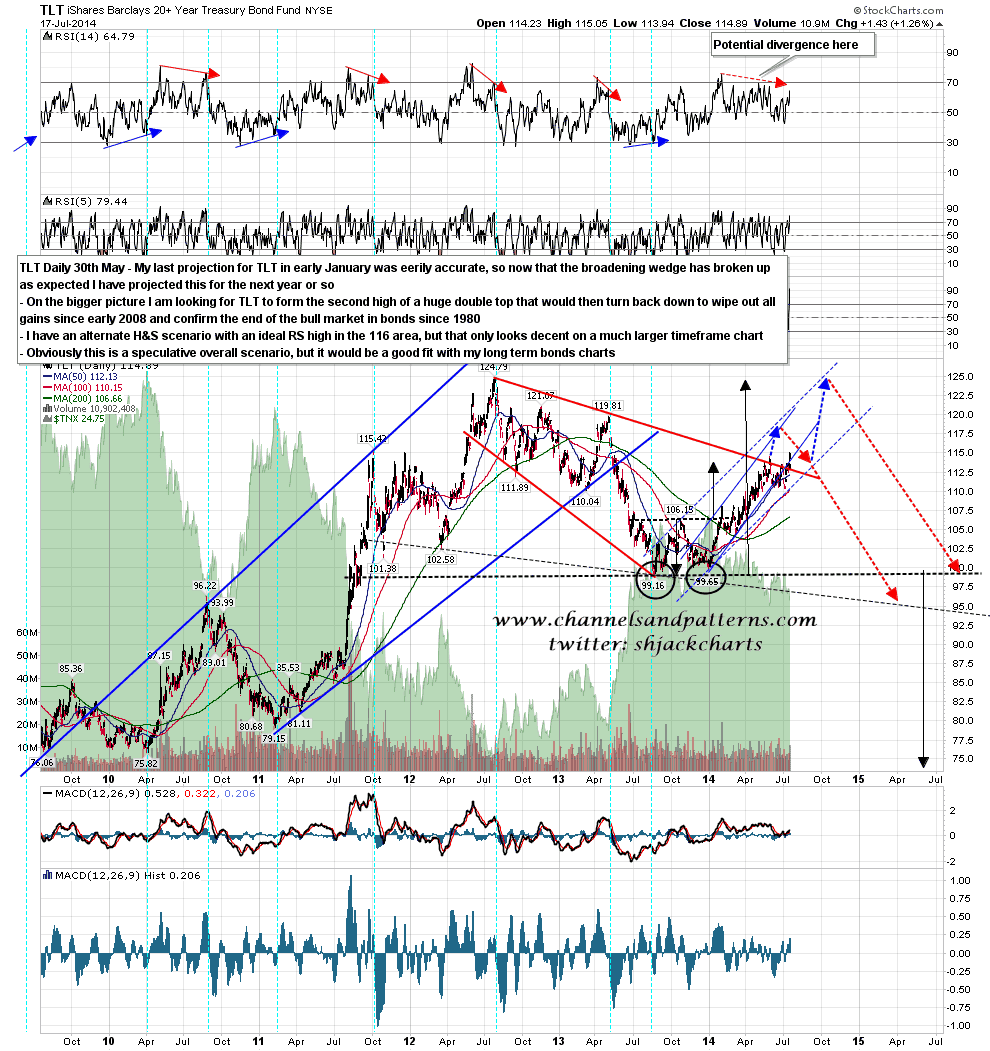
That puts bonds back on the track I laid out on TLT in May, with a likely move to test the 2012 highs that could well be the second high of a major double-top. Here is that chart again to refresh memories. TLT daily chart:
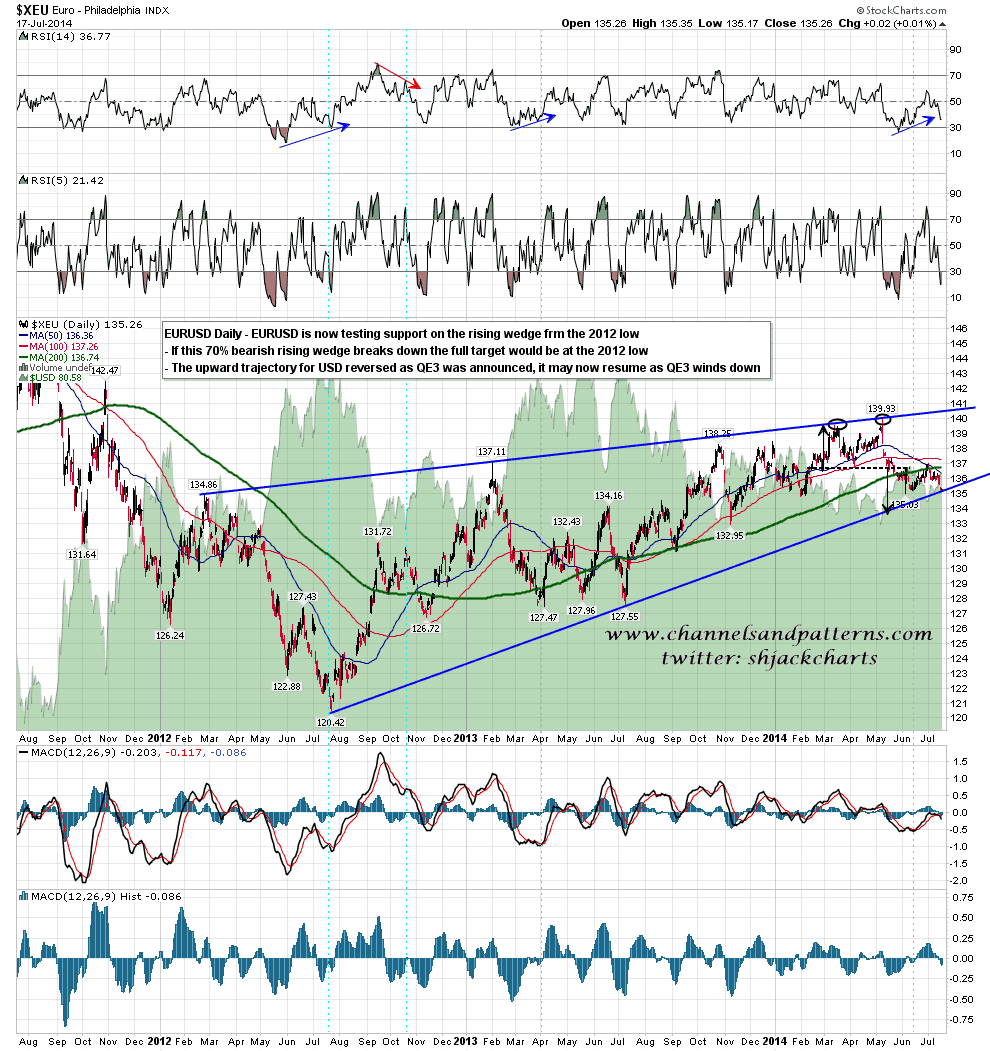
EURUSD has finally made it to test rising wedge support, as I have been predicting for the last three months. If we see a break downwards here I would have an H&S target in the 1.30 area. This is an important inflection point for EURUSD and USD. EURUSD daily chart:
The retracement low should not be in yet on SPX, so bounces like the current one should be shortable. Resistance levels for the current bounce that I am watching are the daily middle band and ES weekly pivot, both in the 1967/8 SPX area, and the 50 hour MA at 1971. Ideally none of those would be broken before SPX tests the last low at 1952, and very possibly the SPX daily lower band in the 1949 area. On a sustained break below 1952 the double top target would be strong support in the 1919 area and, looking at RUT and NDX, I’d be giving that 50% odds of happening here. If that does happen, it might well happen fast.
I’m on holiday the next two weeks, so posts will be irregular over that period. I’m expecting to have a post out on Monday & will be using twitter to post interesting charts as I see them.
