
Greetings from the New Forest (established 1079 AD) in Hampshire, UK. The scenery and weather are lovely, and my internet connection is very slow, so I have been taking some genuine time off to relax rather than following the markets too closely. Things are looking interesting though so I thought I’d take some time today to do two posts, one on equities and the other later on on bonds, precious metals etc.
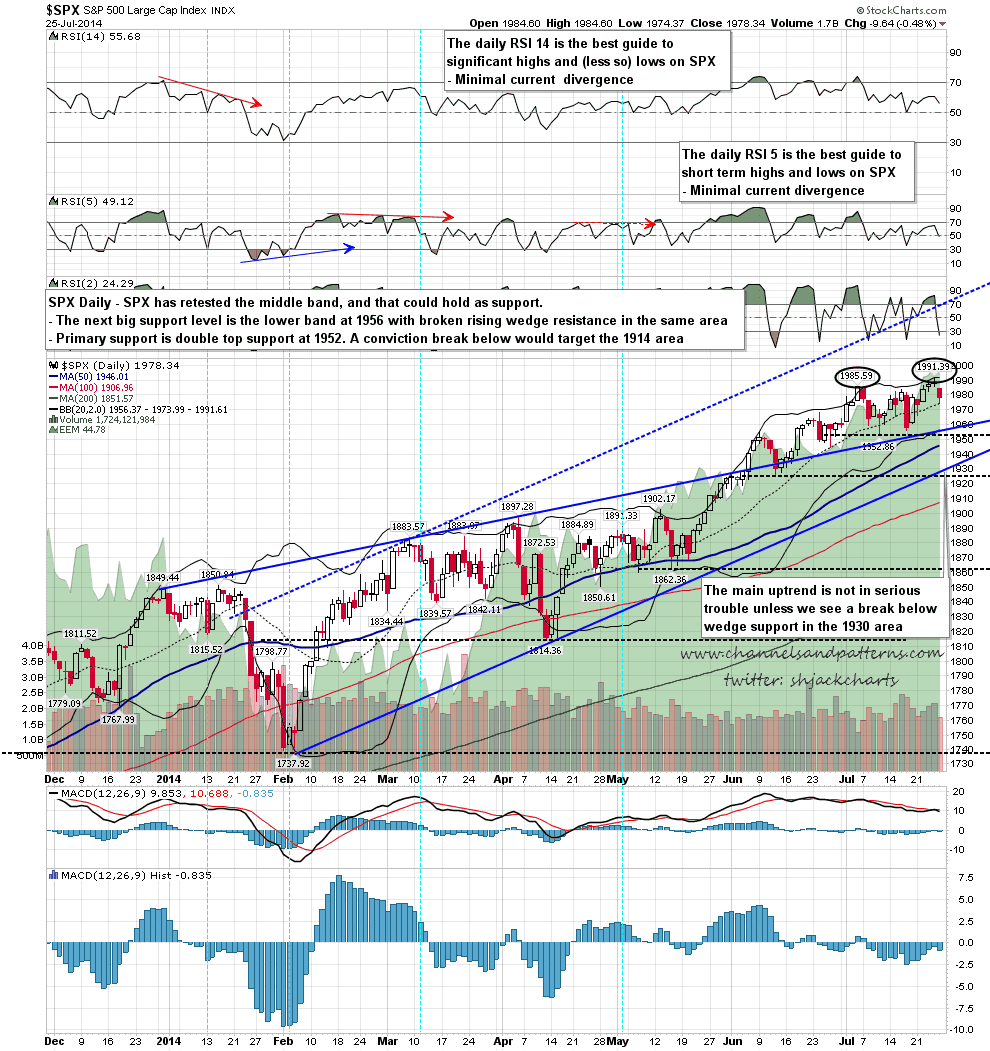
On equities SPX made a marginal new high last week and has pulled back sharply from that setting up a possible short term double-top. This isn’t the first time this has happened in recent months, so there isn’t much to get excited about as yet, but the overall setup favors at least some more downside this week, so I thought I’d have a look at that today. On the daily chart SPX tested the lower band on Friday and has gone lower this morning. There is double support in the 1956 area at the intersection of the lower band and broken wedge resistance, and primary support is at double-top support at 1952. A conviction break below double-top support would target the 1914 area. SPX daily chart:
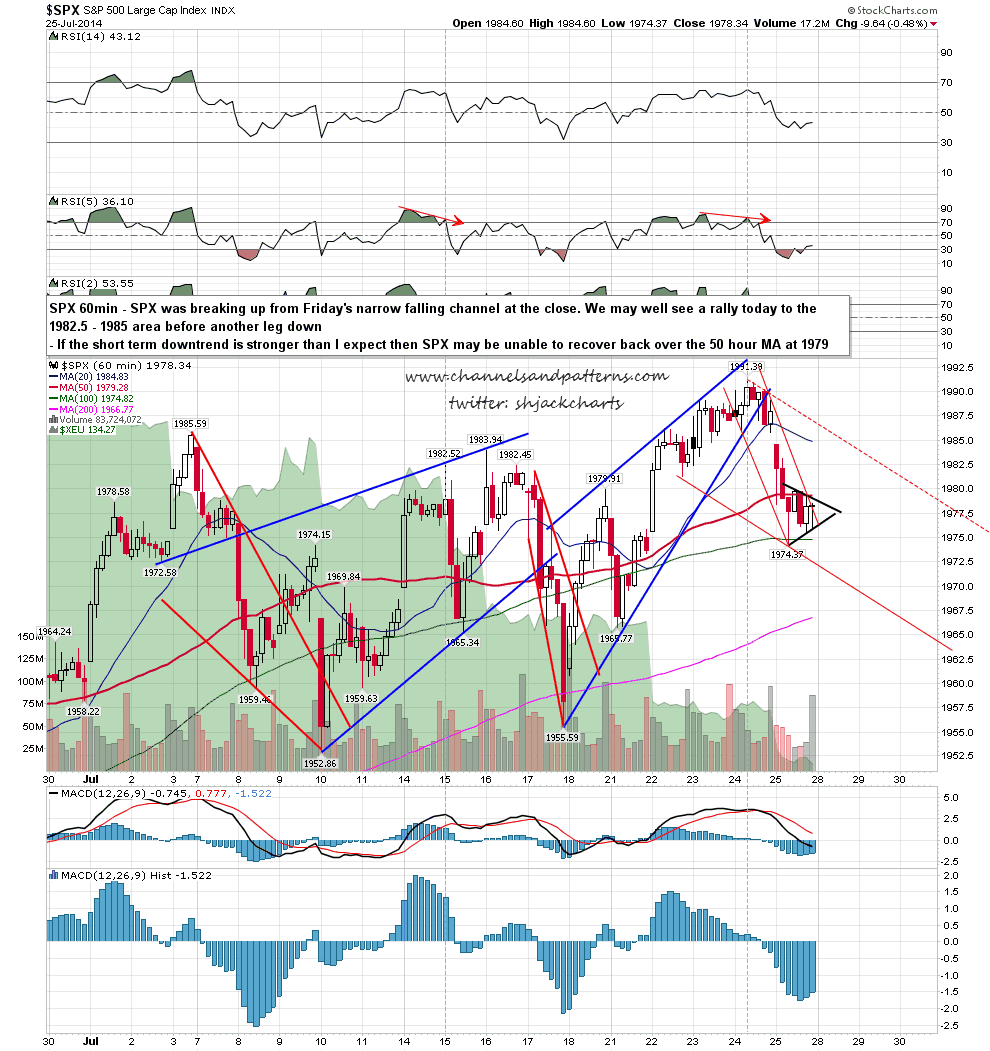
On the 60min chart the action on Friday was within a falling channel that I thought might be breaking up slightly at the close but in fact is still intact. If that breaks up today I’d be looking for a rally to the 1982.5 – 1985 area, and if that held, then I’d expect another leg downwards. There is strong resistance at the 50 hour MA, currently in the 1979 area, and if this downtrend is stronger than I am expecting, then that would most likely be solid resistance. SPX 60min chart:
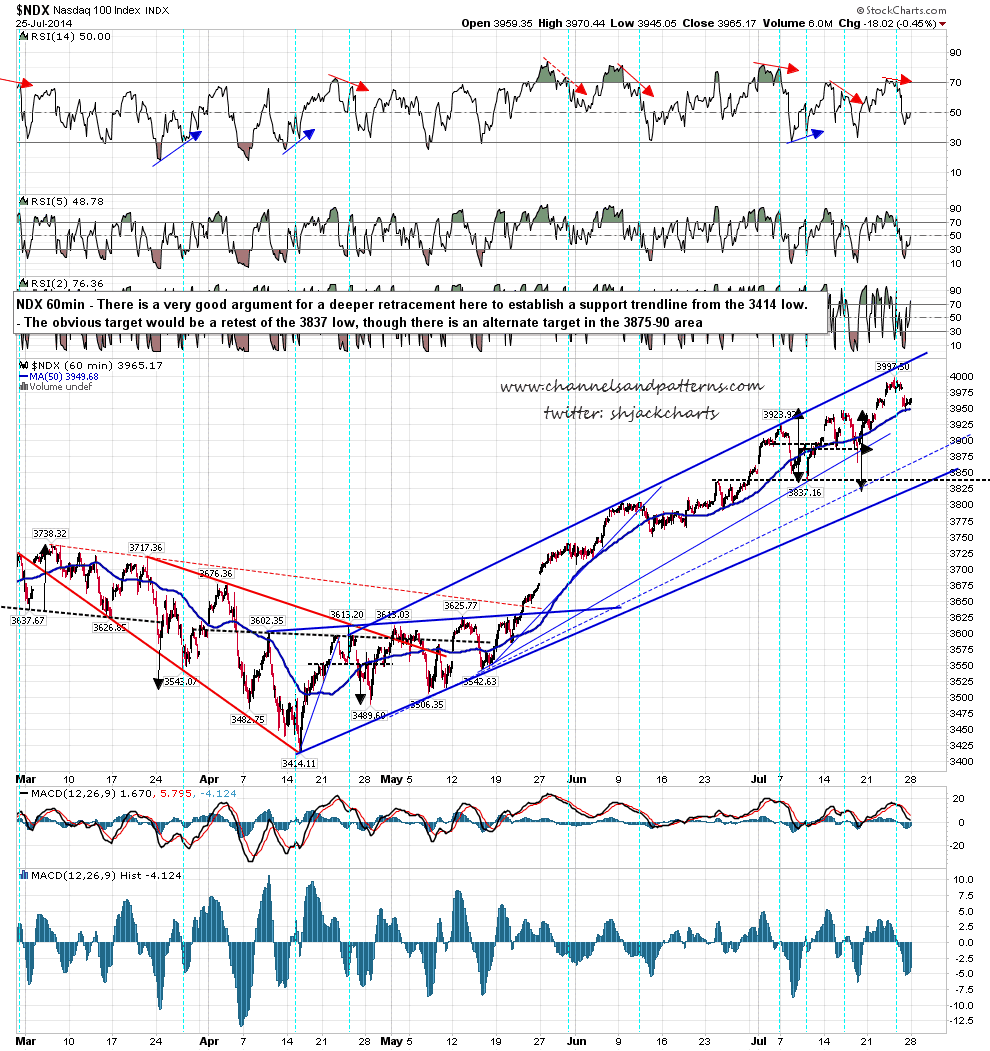
There is a very decent argument for a stronger pullback here that need not be anything more than a decent dip to buy. I have a decent resistance trendline established on NDX here but a retracement to establish rising support from the 3414 low. The obvious target would be a retest of the 3837 low, though I have a possible alternate target in the 3875-90 area. NDX 60min chart:
This post is late up due to my slow internet connection and having to work on a laptop, so I’ll post an intraday chart showing the falling channel from the highs. SPX 1min chart intraday:

The short term topping setup here is decent, and if we see a conviction break below 1952 SPX then a move to the 1914 double-top target would signal that a topping process on SPX would have started. If SPX can hold the 1952 area, then this retracement should just be more consolidation and compression before a larger move up.
I’ll be doing a second post looking at bonds, precious metals, oil etc later on today.
