
This is a short primer on applying Artificial Intelligence (AI) techniques to your trading activities. AI can bring a fresh approach and a different perspective to anyone willing to invest the time and effort to learn how to combine some simple programming skills and common trading knowledge.
First off, I will fully admit that while I am not an expert in either trading or artificial intelligence, I know a bit about both, which is probably just enough to be dangerous. Furthermore, I will make the claim that being a mediocre programmer and a semi-skilled trader puts you ahead of either world-class programmers that know nothing about trading, or top-notch traders that do not understand the basic concepts, advantages, and limitations of AI. Think about your current skills and where the biggest bang for invested time lies. If you buy commercial AI trading software to save some effort, expect that just throwing some data and a few preselected indicators at it will not be very productive.
AI in a trading sense is a computer program that has the ability to change or adapt the way it processes data, over time or as new information becomes available, or even as the program is run multiple times. This capability differentiates it from programs like Excel. Running an AI program many times, over and over, typically improves the results as the program learns from its errors, whereas running Excel over and over gives you the same result. AI programs synthesize an appropriate output for which there is no existing data, but use similar historical situations to decide what is most likely to occur.
Classes of AI
This primer will review four types of AI: expert systems, neural networks (NN), ant colony optimization (ACO), and Support Vector Machines (SVM). Judging solely by the number of books and papers on the topic, NN are the most frequently types of AI applied to trading and is the most detailed review here; feel free to skip directly to the section on NN if you just want to read the most popular topic. And since developing, training, and using AI is a heavily time intensive undertaking, few people using AI will tell you much about their successes or failures. Most of the papers and books come from academic sources, not from traders. Whatever traders know will likely be highly proprietary. Fortunately, searching on any term in the AI field will yield a wealth of links and far more information than you could ever read.
Expert Systems
Expert systems are created by specially trained programmers that collect and categorize the knowledge, opinions, and experience of multiple people that have first-hand experience in a particular field. Expert systems have found wide application in such diverse areas as medical diagnosis, automotive repair, and manufacturing optimization. An expert system, whether used in trading or elsewhere, will be in essence the same as having the most knowledgeable senior person locked up in your computer, so they are as valuable as any other Intellectual Property. Applying expert systems to trading, for example, if you wanted to build an expert system to trade emerging market bonds, you would interview the best EM bond traders available, asking them what particular events, data, setups and triggers that they use to trade on (and this could only be done entirely in-house). Of course the expert must be able to accurately describe the why and how of the trades they do, or the system will fail. Expert systems can be used in combination with other AI techniques such as Neural Networks.
Neural Networks
Neural Networks (NN, also called Artificial Neural Networks, ANN) mimic in some primitive fashion the way humans use axons, neurons, and dendrites to process information and make decisions.
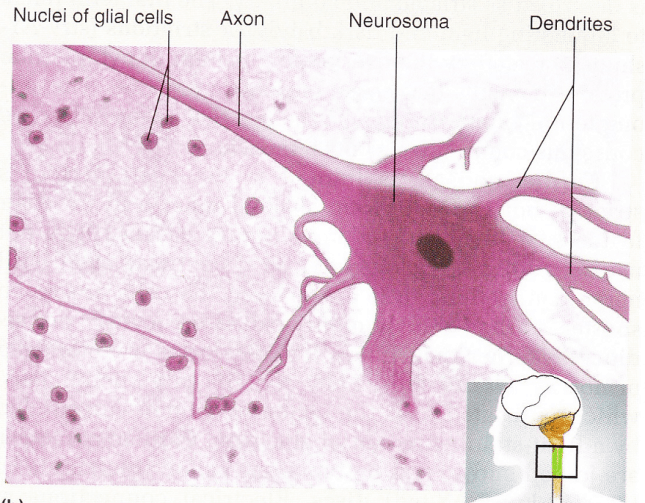
Photograph of a spinal cord neuron from Anatomy and Physiology by Kenneth Saladin
Signals received by the dendrites are processed bythe neurosoma and sent out along the axon to other cells
In a real neuron, electrochemical processes trigger a reaction from dendrites to axons. The human mind is reported to have about 86 billion neurons. http://www.theguardian.com/science/blog/2012/feb/28/how-many-neurons-human-brain
In an artificial neuron, input data (one or more signals) is operated on by common linear mathematical functions such as addition and multiplication; however in the neuron there is a complex transfer function that can perform non-linear operations on the signal. As more and more neural elements are paralleled or cascaded in ever more complex arrangements, the computational processing power increases exponentially. A fairly simple NN can perform incredibly complex operations that are beyond the capacity of most users to understand. Even at relatively low levels of complexity NN often defy understanding, and may be thought of as “black boxes” – you put in some data, and the NN produces processed information, but the user will never be able to grasp how the NN goes from “A” to “B”.
A NN is composed of as few as one or two to as many as hundreds of artificial neurons, interconnected by various paths which have weightings that adjust the strength of the signal applied to each input.
In a NN computer program the neurons and pathways are represented by signal levels, which are themselves binary information in the computer running the AI software. Usually the output signals are normalized or constrained to the range of -1 to +1, or 0 to +1, for convenience, while input signals may occasionally exceed that range. A drawing of an artificial neuron is shown below. Multiple identical neurons will be interconnected to build the complete neural network.
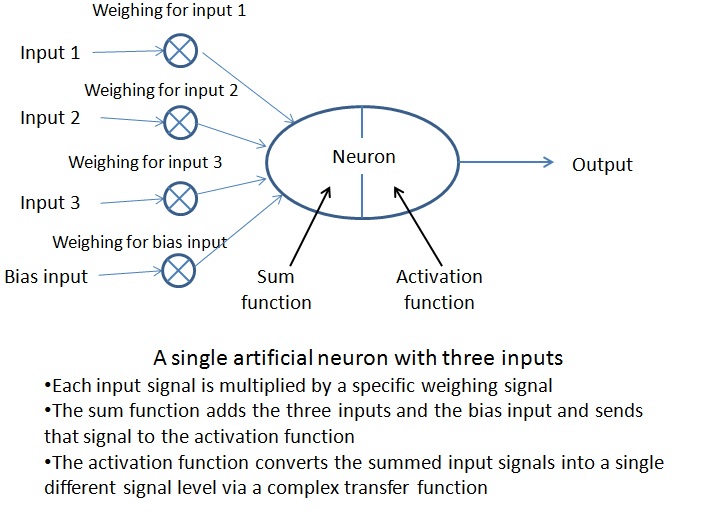
Each neuron is composed of two sections – a summer that adds the input signals into a single signal, and an activation function that converts the summed signal into a signal transformed by a specific transfer curve. Typical transfer curves are shown in the drawing below, with the input signal on the X-axis, and the resulting output signal on the Y-axis, for three possible functions. Note the input can extend beyond the -1 to +1 range shown in the plot.
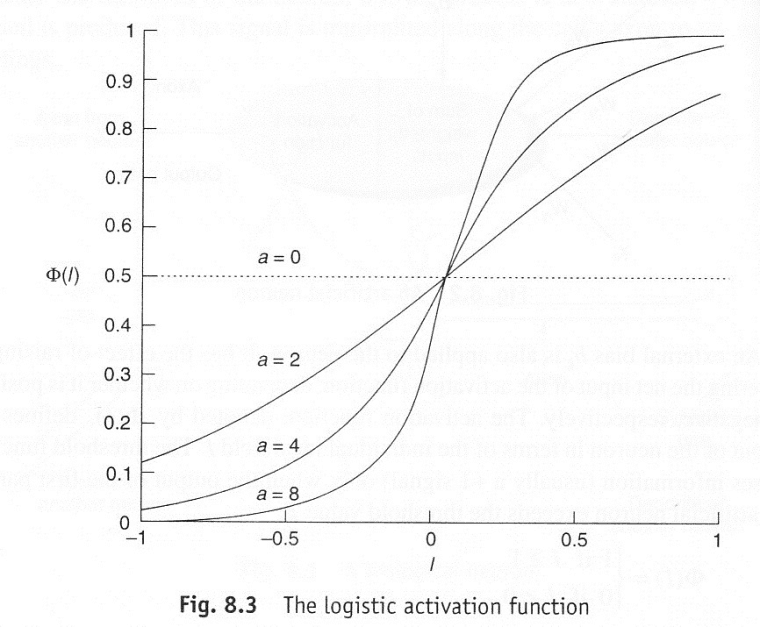
A non-linear activation function
The sum of the input signals is transformed to the output signal via one of the three transfer functions
The output is limited to a range of 0 to 1, while the input range is unlimited
From Artificial Intelligence and Intelligent Systems by N. P. Padhy
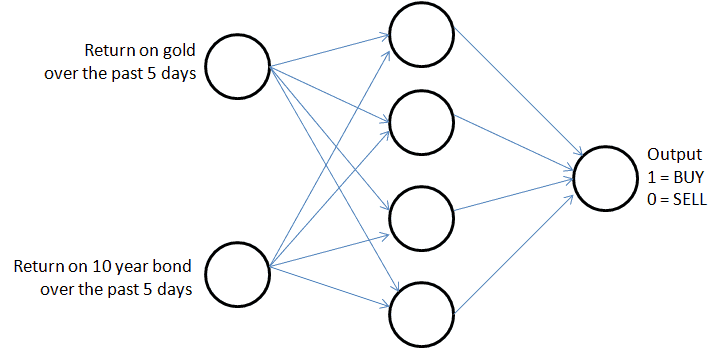
The next drawing is of a simple NN. Note there are three layers. The input layer is merely a series of connection points to distribute input signals to the neurons in the hidden layer. The hidden layer does most of the processing. The output layer organizes the various intermediate signals into either a numeric value, usually in the range of 0 to 1, or into a binary signal, such as “buy” or “sell”. In this network every possible interconnection has been made, although this is not always the case.
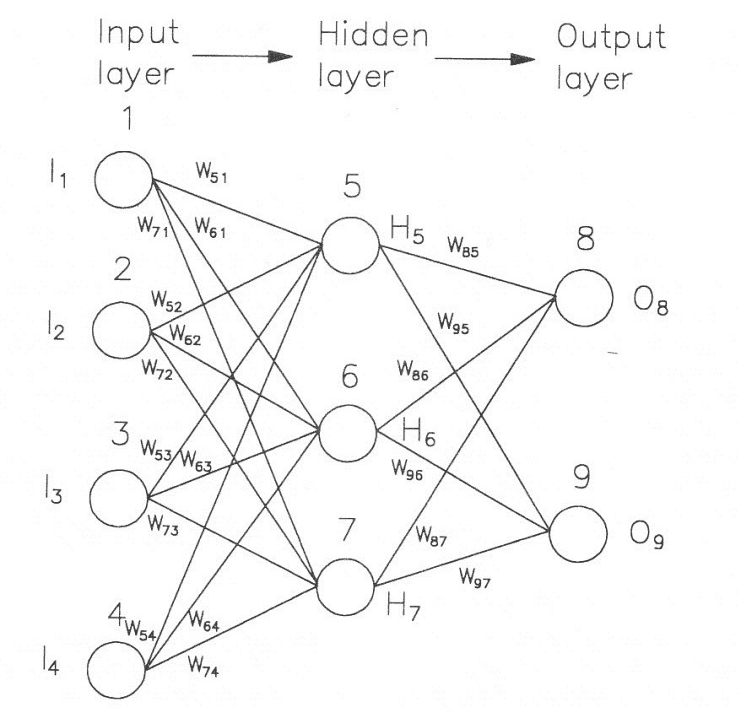
A small Neural Network
I1, I2, I3, I4 are Inputs, O8 and O9 are outputs; the “W’’s are weighing factors
Elements 1 through 4 are basically tie points, Elements 5 through 9 are single neurons as shown above
From Neural Networks for Economic and Financial Modeling by Andrea Beltratti
During the development process, data sets and goals are presented to the NN in a process called learning. The NN is initialized with some random values in the variable fields and is given an appropriate number of neurons. During learning the various pathways, weighing values, and number of hidden layers and neurons will be varied in a specific manner and an overall error value calculated. The error value represents how far away the typical output is from the goal. Choosing the best data and appropriate goals is a major part of building a successful NN.
NN excel at pattern recognition and pattern optimization, although not necessarily at the same time. For example, NN can be taught to recognize license plates in photos, and blur the image to make the license numbers indistinct. This is a form of pattern recognition – start with many different photographs of plates, digitize them in some manner so the NN can work with them, and present them to the NN. This is training. Training with additional sample photos is continued until the NN can recognize any new photo. This is called generalization. The NN has taken some aspects of the photos and synthesized (“learned”) an algorithm that will identify a license plate in a photo that it has never seen before, with numbers and letters in a new sequence, at an angle it is not familiar with, and at a scale it has never used. Conversely, if shown a rectangular plate of the correct size with numbers and letters printed on it, for example a street sign, the NN will recognize it is not a license plate. Another potential application is recognizing human faces, for photography or security. NN have often been applied to reduce credit card fraud and identify bankruptcy candidates.
Neural networks seem to have had ups and downs in popularity. Major flaws have been found several times, people lose interest, and then someone discovers a solution to the problem. Two major breakthroughs in NN technology were non-linear capabilities, and optimization routines. Both breakthroughs are critical for using NNs in trading environment.
Many problems require non-linear capabilities for a solution. Here is a simple NN trading imaginary relationships between gold, bonds, and stocks. The NN categorizes points on graphs of an intermarket strategy that looks at past gold and bond prices to decide whether to buy stocks. A linear network will separate the buy and sell signals into two regions according to a simple straight line and perform poorly. A more complex non-linear network, such as the NN shown, will separate the buy and sell signals according to a much more complicated formula. Of course, the intermarket relationship is not static and that must be allowed for when using a system like this for trading.
A simple Neural Network using an intermarket strategy to buy or sell stocks
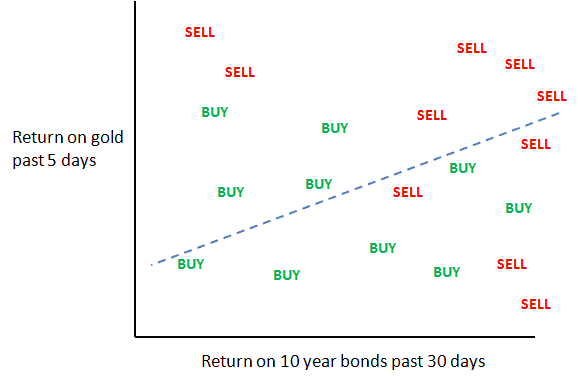
Linear decisions typical of a simple rules based system
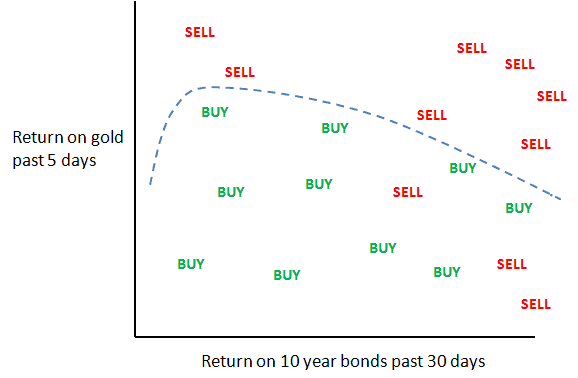
Non-linear decision capability of the simple neural network
Neural networks can generate far more complex relationships with many more variables
Real world NN are generally far more complex than our simple network above. You can have many dozens or hundreds of inputs, and the NN can find extremely subtle relationships among these inputs that elude even astute market observers. For example, you could use historical interest rates for many different bonds, their 30 and 60 day changes, and how far away the current prices are from several moving averages. You might want to use a time period extending back before interest rates started a secular bear market in 1980. Daily, weekly, or monthly data is then paired with a goal (buy, sell, hold). If there is a pattern hidden in all of the noise, eventually the NN will find it. The NN can also find every possible spurious or temporary correlation and try to trade on them; experience and understanding of both markets and NN will help avoid these types of pitfalls.
Ant Colony Optimization
Ants individually have but a few thousand brain cells and are quite dumb, but many ants together form complex societies; as a group they can hunt for food, establish complex homes, and wage war – the colony is collectively highly intelligent. Ant colony optimization is one category of what is called swarm intelligence. Swarm intelligence is exhibited by ants, termites, bees and wasps, birds, and fish, but we will use ants in our study. Ants secrete a chemical called a pheromone that they are extremely sensitive to, as low as a few molecules. When ants from a colony bump into each other they trade pheromones. As they move around the colony’s neighborhood they periodically deposit small traces of the chemical, as time passes the chemical breaks down until it is no longer detectable by another ant. As ants repeatedly travel from a food source to the nest and back again, the trail of pheromones becomes reinforced, and more ants follow it. One key to ant behavior is how fast the chemical signal weakens, a depleted food source will not attract foraging ants. A second key is not all ants will follow the dominant chemical trail; a few ants will always buck the system and try new paths. As the main food source is consumed, the weaker pathways will begin to be used more frequently. How can this be applied to real problems? One area this type of AI has been applied to is traveling salesman problems, which attempt to optimize processes like mail delivery and garbage pickup. An ACO program will utilize random pathways connecting all possible points we wish to visit, and “deposit” a small signal representing the pheromone along each path. Simulated ants will roam the pathways, and the fastest paths will display the strongest pheromone signals. In addition to travelling salesman type problems, ACO has been applied to other routing and scheduling situations. ACO may be useful for optimizing the dates of periodic investments such as monthly contributions to a 401k, dollar cost averaging, or share buybacks.
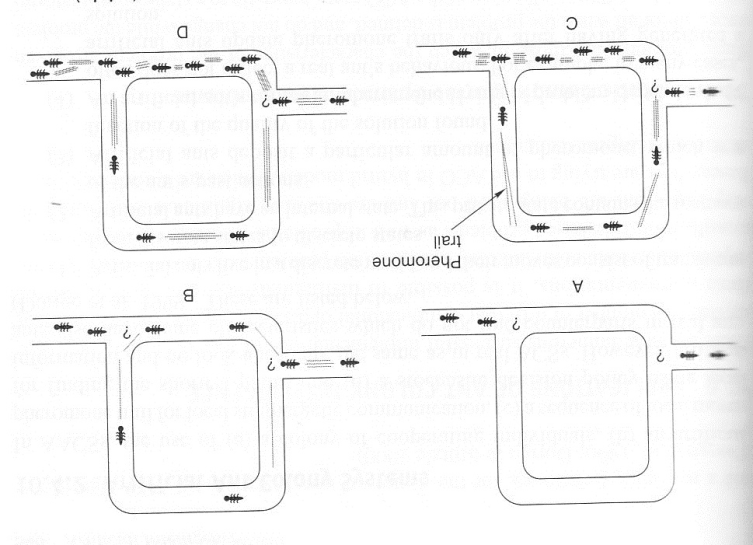
Ants finding the shortest route via pheromones
From Artificial Intelligence and Intelligent Systems by N. P. Padhy
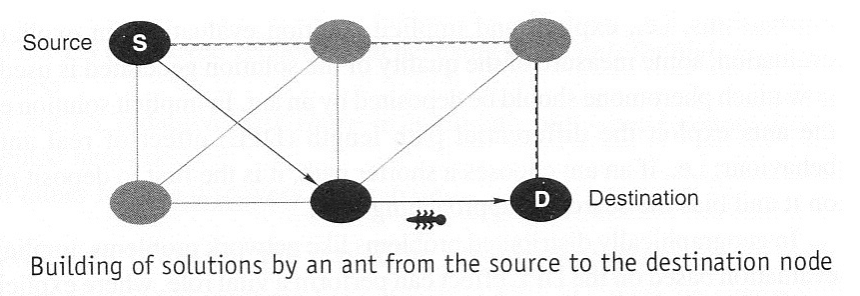
A simulated ant exploring multiple pathways to reach a destination
From Artificial Intelligence and Intelligent Systems by N. P. Padhy
Support Vector Machines
Support Vector Machines (SVM) are a type of AI software that perform classification on a data set. SVM can categorize data as bullish or bearish, for example. They differ from NN in that while a SVM can categorize data as bullish or bearish, a NN can also generate a numerical output, such as “the average gain under these conditions is 14%”. SVM software is similar to NN and learning to use one type will be helpful in migrating to the other.
The nuts and bolts
Commercial software for the AI systems described is readily available, with costs running from sub $100 to multi $1000. Some of these software packages are specifically designed as trading systems. There are a few free packages that have been released that may be usable, but in general they are probably more trouble than the savings would justify.
You will need data to train and evaluate your AI system. There are plenty of free chart services but actual usable data is surprising hard to find. (Usable data means in a spreadsheet or similar list.) OHLC data for most stocks and indices is available from Yahoo and other providers for nothing, but it is notoriously error-ridden and prone to survivorship bias. Norgate (http://www.premiumdata.net/) is a step above Yahoo/Google for EOD data. Intraday data for stocks and indices is pretty much only available through subscriptions. Plan to spend much more time finding and fixing errors than you will spend in downloading, especially if you rely on free data. Historical data for complex indictors like breadth and percent above moving averages is also quite difficult to find.
It’s very common to cheat when using mechanical trading systems; you run the software a few minutes before the close, assuming that the closing prices and volume will not change too much. AI is no exception. If you’re fast you may get away with it, but if it takes 15 minutes to process the data and a few minutes to enter your order you’re probably not going to get the results (as in $$$) you expected when you ran the program using closing data.
You will probably need to do some data preprocessing. For example, if one input to your AI system is how far away the closing price on the S&P is from its 50 day EMA, you will probably have to do the 50 day EMA calculation in Excel. Not too difficult, but if you have a half dozen indices and eight moving averages, along with four different RSI periods and a couple of Bollinger Band calculations, all done over 20 years of data, suddenly the little spreadsheet has become a monster and you’ll be wishing you had a faster computer. And that’s before you even start running the AI software.
A common criticism of AI is you won’t be able to easily determine how the software came up with whatever output it generated. It’s a black box in that sense; you provide input data and train your system, and out comes trading directions. You can’t “look under the hood” and see that the system is currently sensitive to RSI and distance away from the Bollinger Band, because tomorrow the system will be sensitive to MACD and breadth. You can trick the system by applying false data that you have intentionally changed to see what it’s sensitive to, but this is a shotgun approach that is difficult and time-consuming.
Helpful Hints
Data for AI software (except for expert systems, which are usually queries) is organized into inputs (historical data) and outputs (or goals or historical performance). Spreadsheets are typically used to organize the data and goals. How much data is necessary? It depends on how clearly defined and stable any correlations are to the specified goals. If one set of data yields a buy signal while another identical set of data at a different time yields a sell, a NN will be confused and will generate useless information when that situation is encountered during operation. A common rule of thumb is around 2000 data points are needed – for daily data that is around eight years. Also consider that hourly predictions do not generate well from daily data. Sometimes less data is better, if it is carefully selected to be representative of many different market environments. If you provide too much data, or are not careful during training, it’s possible to overtrain AI software, where it becomes curve-fitted to very specific situations and won’t generalize well. Data is usually split into three groups called training, validation, and test. Running training data through the AI causes the software’s algorithms to adjust the internal parameters for the best overall output’s match to the goals, while validation data is monitored to see if the NN is becoming overtrained. Test data is used for the “what-if” scenarios, such as the current market environment. It may take a million runs through the data to achieve a reasonable fit between the specified goals and what the AI generates for that input data. Here is a short data set for training a NN to evaluate race horses.
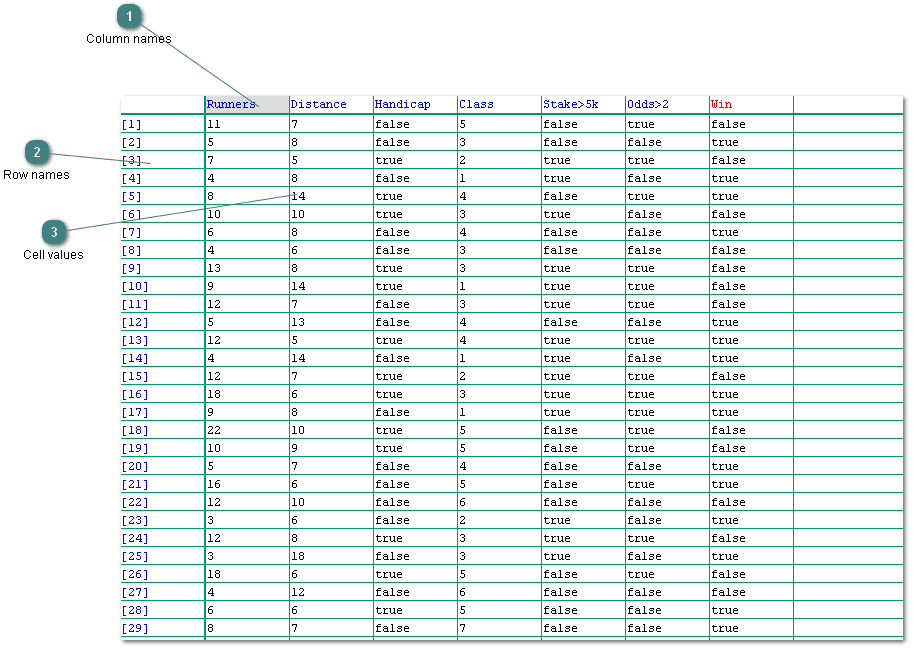
A sample data set for a horserace handicapping NN for 29 races; six relevant inputs
are in the blue columns and historical race results is in the last red column
From JustNN users manual
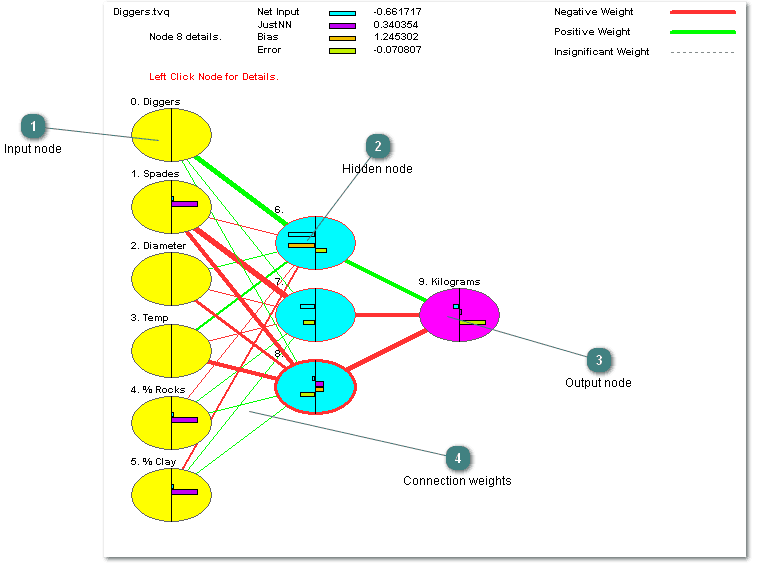
The NN created for determining the time required for digging holes
From JustNN users manual
Generally the AI software will set the percentage of data in test vs validation. A guideline is in the 85% area for training and the remainder in validation. It is critical that there is some relationship between the input data and the goals. If the input data have no relationship to the outputs, or the relationship changes significantly with time, the AI software will not be able to generalize well – you’ll get some output signal, but it will be useless for trading. For example, you could train a NN to recognize a head and shoulders (H&S) pattern, the NN will be able to learn the pattern, but if H&S have no value in forecasting future returns the NN will be useless.
It’s possible to have more than one AI program running simultaneously on the same data. You can then observe the multiple outputs to see if there are some common features of the data; this is called voting, or a committee.
Consider your trading goals when deciding whether to use classification or prediction types of AI. It’s far more difficult for an AI program to accurately generate an output of “4% gain over the next week” than it is to generate an output of “the market will probably go up in the next three to six days”.
And finally fuzzy logic is not part of AI, but can work very well with it. Fuzzy logic is a set of numbers that allow you some leeway; they are a range of possibilities. For example, you want to trigger a trade when a price touches a specific point, like a moving average. But what if the price is $0.05 away? Is that close enough? Crisp numbers, the ones we usually work with, say no, they are not the same. Fuzzy numbers allow some fudge factors – “way above”, “close to”, and “touching” have specific meanings in fuzzy logic, and the concept can be very useful when you don’t want the exactness of normal numbers.
Conclusion
AI has been applied to trading by a number of institutions and funds, with varied success. It’s probably a safe assumption several hedge funds are using it, but like other techniques if it works they won’t brag about it, and if it failed they won’t mind you going down the same dead end path. For the typical small retail investor it will represent a significant investment in learning and development time, without any guarantee the results will be in any way commensurate with the time spent. But to me this is a great opportunity – the more difficult it is to develop, debug, and run programs, the more likely only a few traders will try and take advantage of AI software. Perhaps the field of AI has been picked clean, or perhaps not entirely. I see it as the chance to take a small slice out of a very large pie.
