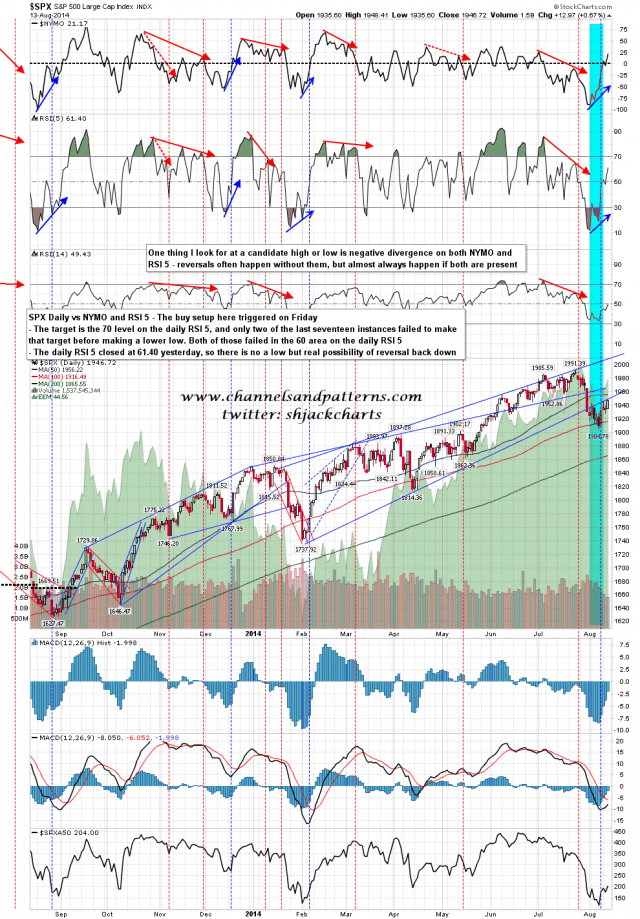
The SPX daily RSI 5 closed the day over 60 yesterday so the bears now get a shot at turning this round at strong resistance in the 1948-56 range. History still isn’t encouraging for that, as only two of the last seventeen of these buy signals back to 2007 failed in this area, but it could happen. A reversal here might still just be a retracement however and would not necessarily lead to new lows. SPX daily vs NYMO and RSI 5:
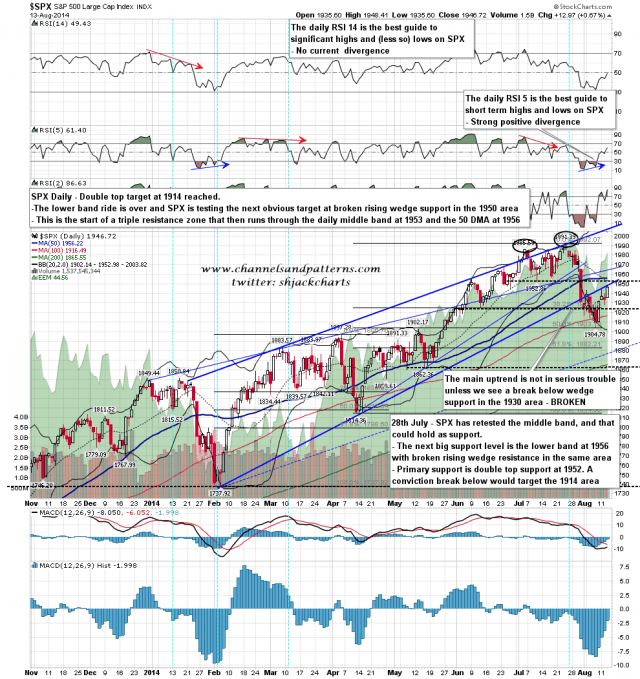
The resistance range here starts at the test yesterday of broken rising wedge resistance at 1948, continues through the daily middle band at 1953, and ends with the 50 DMA at 1956. If bulls can deliver a a decent close over 1956, then I’ll be looking for the retest of the highs. SPX daily chart:
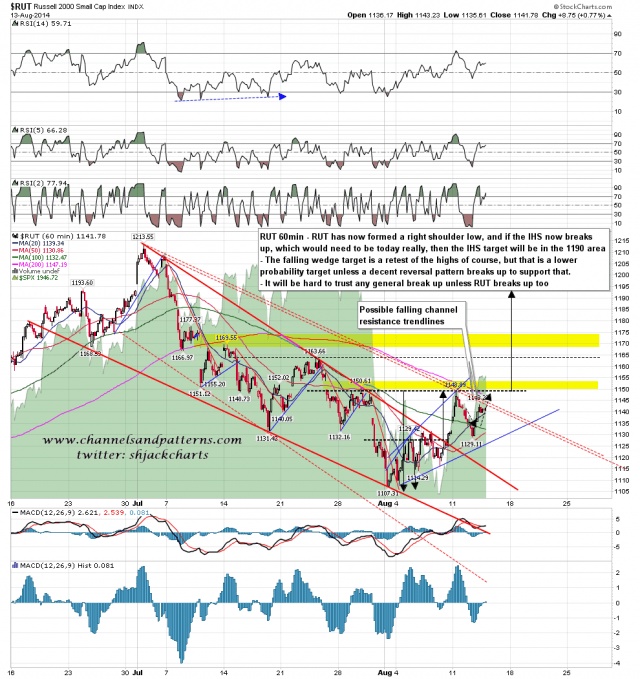
So how is the long setup looking here? Well, it has been weakened a lot by RUT’s failure to break up over the IHS neckline as yet. RUT has started to lag SPX again and that is a concern as the last SPX break up without support from RUT was slapped down very hard. RUT could change this situation today but while it is failing in the current area that is definitely undermining the bull case here. RUT 60min chart:
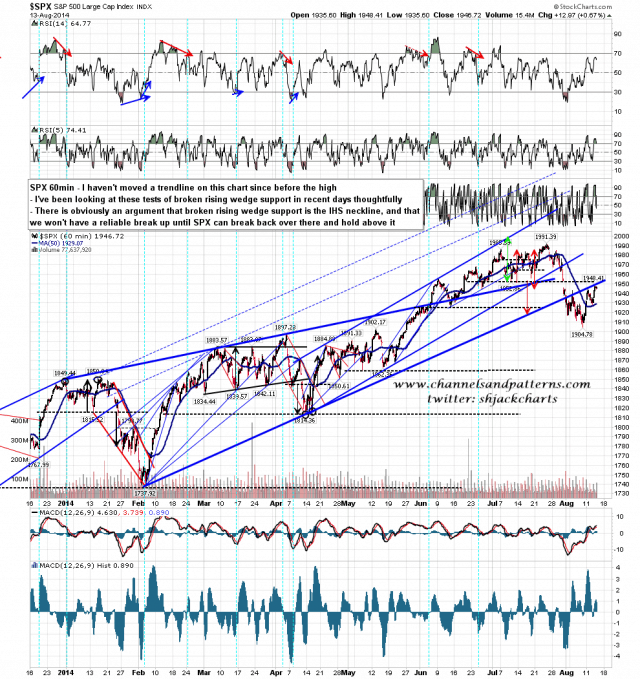
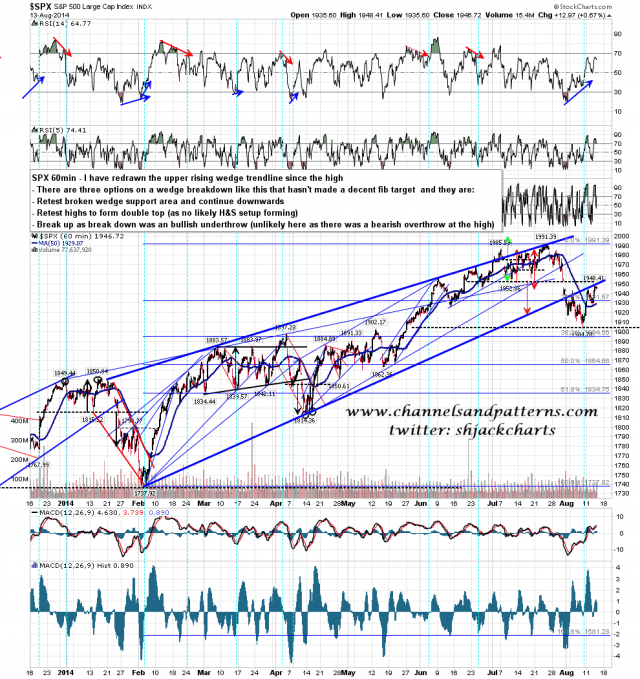
Another concern I have here is both that broken rising wedge support has been very solid resistance so far, and that the true neckline on this SPX IHS may actually be that broken rising wedge support trendline. I haven’t updated any trendlines on the chart below since before the high and you can see what I mean looking at the tests of broken rising wedge support in recent days. Either way it is obvious that this trendline is now serious resistance, and the first priority for bulls here is to close a day back above it. SPX 60min chart V1:
Here is a version of this chart with updated trendlines. I haven’t changed the wedge support trendline but I have drawn in what is now obviously the true resistance trendline for this rising wedge. I’m a bit surprised by this as I see rising wedges evolve into channels often, and megaphones sometimes, but I can’t recall the last time that I saw a rising wedge break up and evolve into a larger rising wedge. Nonetheless this has clearly happened here and this is a very nice quality pattern. At this point in a rising wedge like this there are two main options. If broken rising wedge support is respected on the retest then I would expect a move to one of the 38.2%, 50% or 61.8% fibs in a larger degree bull trend, and a full retracement in a larger degree bear trend. If SPX can break back above broken wedge support then I would expect a retest of the highs and very possibly new highs as part of a topping pattern, with the proviso that wedge resistance should not be broken again. That should limit any new highs here. SPX 60min chart V2:
This is a key area and bulls may decide the next few weeks with a break above resistance today. If we see a failure today it’s important to remember that might just be a retracement before another move up that does then break over resistance. If we see new lows made here then I would be looking at minimum for a test of the 200 DMA in the 1865 area, and most likely lower.


