
SPX touched the daily upper band at the high yesterday and also tested the 50 hour MA at the low, so the two key targets that I gave yesterday morning were both made. So what now? Well I’m still looking for a (hopefully marginal) new all time high, so I’m looking for at least one more test of the upper band, but once there SPX is at a fork in the road and I’m going to talk about the bull and bear scenarios there.
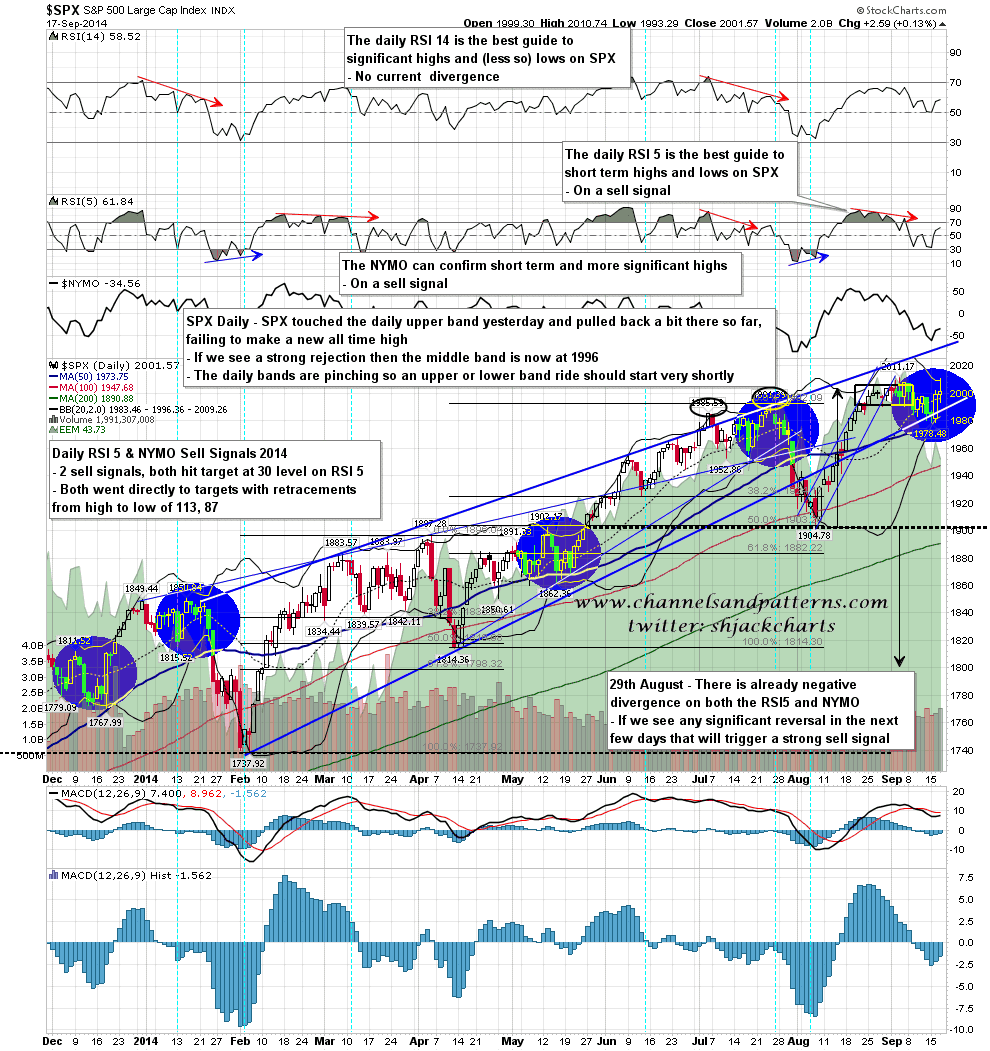
The daily bands are pinching sharply here and that means that there is a very high probability that SPX is shortly going to start either an upper or lower band ride lasting at least three days and possibly much more. I’ve marked the last four daily band pinches on the chart below. The direction is unknown though the odds I gave yesterday of a downward resolution here at 2 to 1 is where I see the odds of the band ride here as well. What this means in practical terms, given that SPX tested the daily upper band yesterday, is that if we now see a strong new high, then this is most likely resolving upwards.
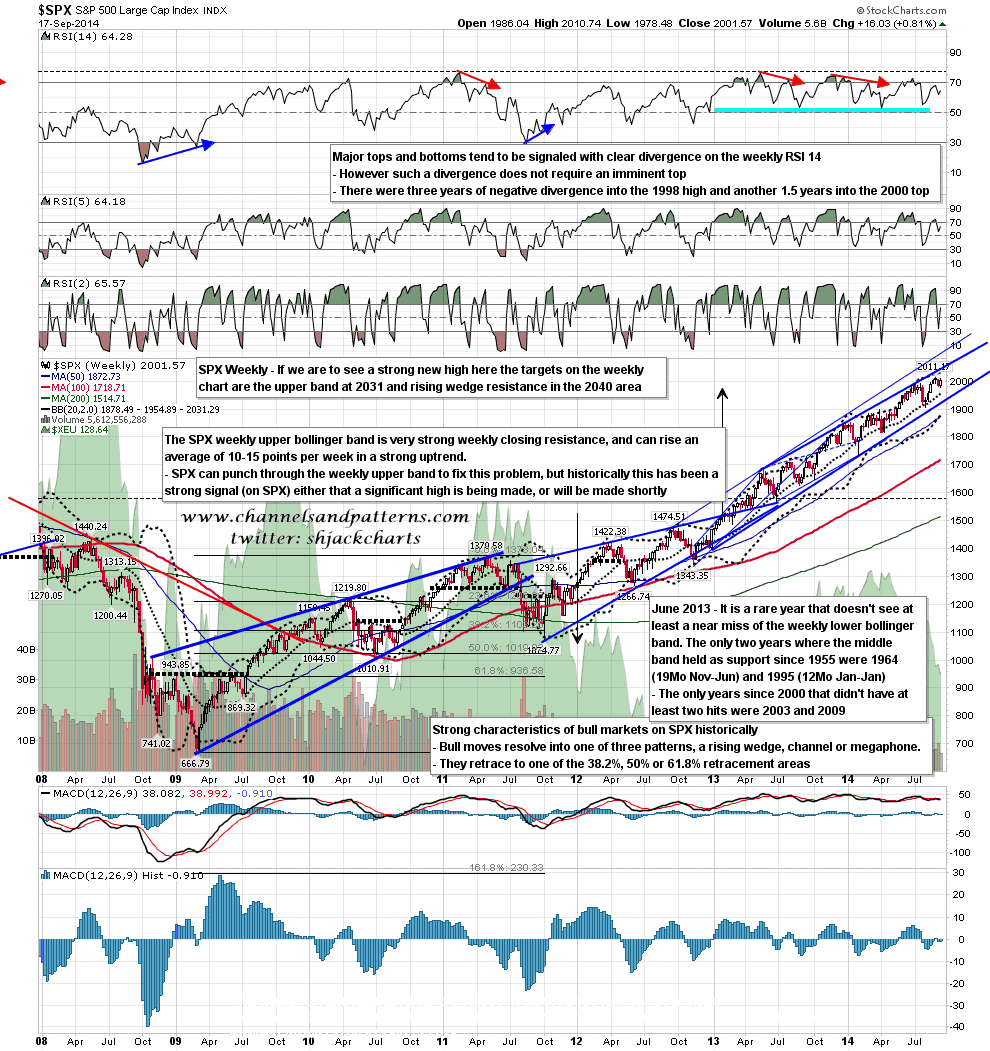
Resistance on the bull scenario is currently at rising wedge resistance on the daily chart in the 2035 area, larger rising wedge resistance on the weekly chart in the 2030-40 area, and the weekly upper band, currently at 2031.
Downside targets on the bear scenario start at the 1940 area on a break below the 1978 low, then a possible test of the 1904 low, and then on a sustained break below 1904 main double top support, I would have a double top target in the 1795 area. SPX daily chart:
SPX weekly chart:
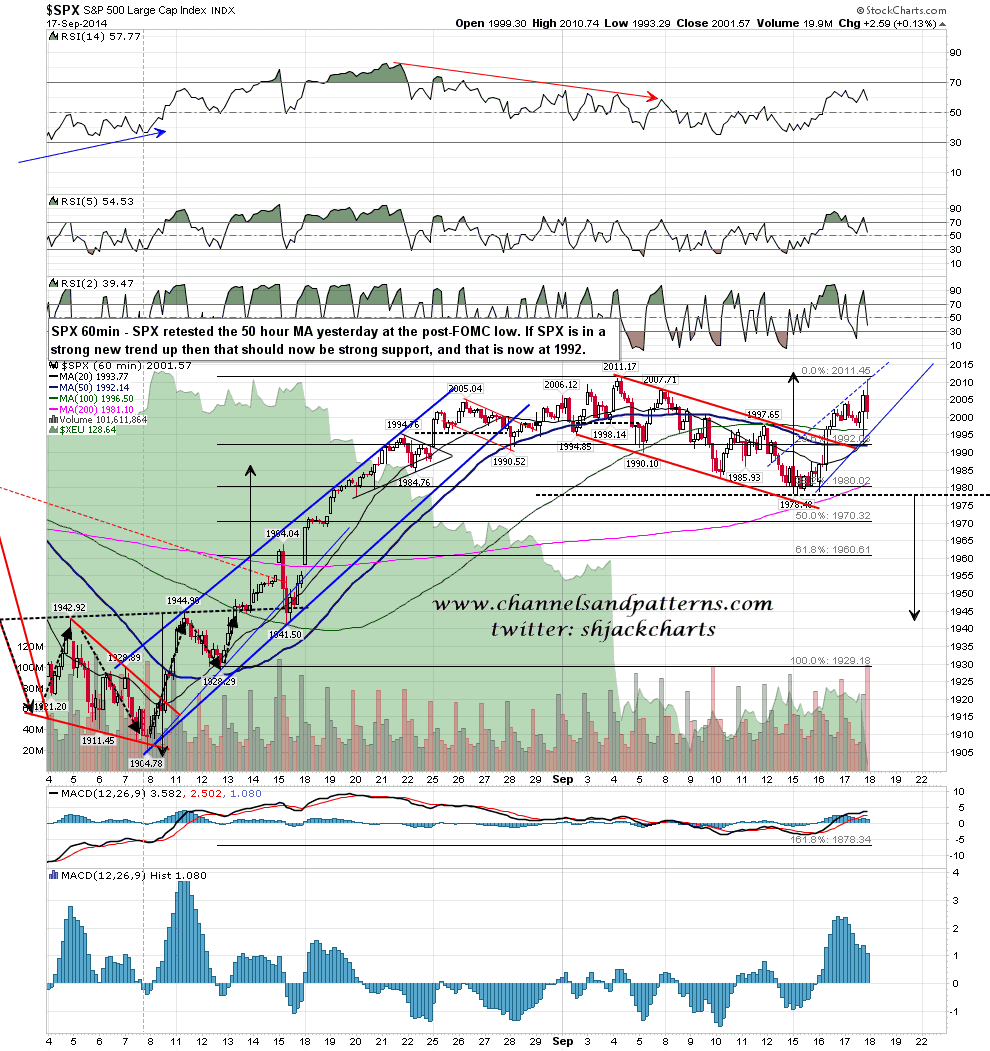
What would be a serious sign of weakness here? Strong rejection at a new high obviously, but also a significant break below the 50 hour MA, as in a strong uptrend that should be very strong support. If support there isn’t holding, then the chances are that we are not in a strong uptrend, and the daily band pinch is telling us here that SPX will be in either a strong uptrend or downtrend within days, so we might well then be starting a strong downtrend. SPX 60min chart:
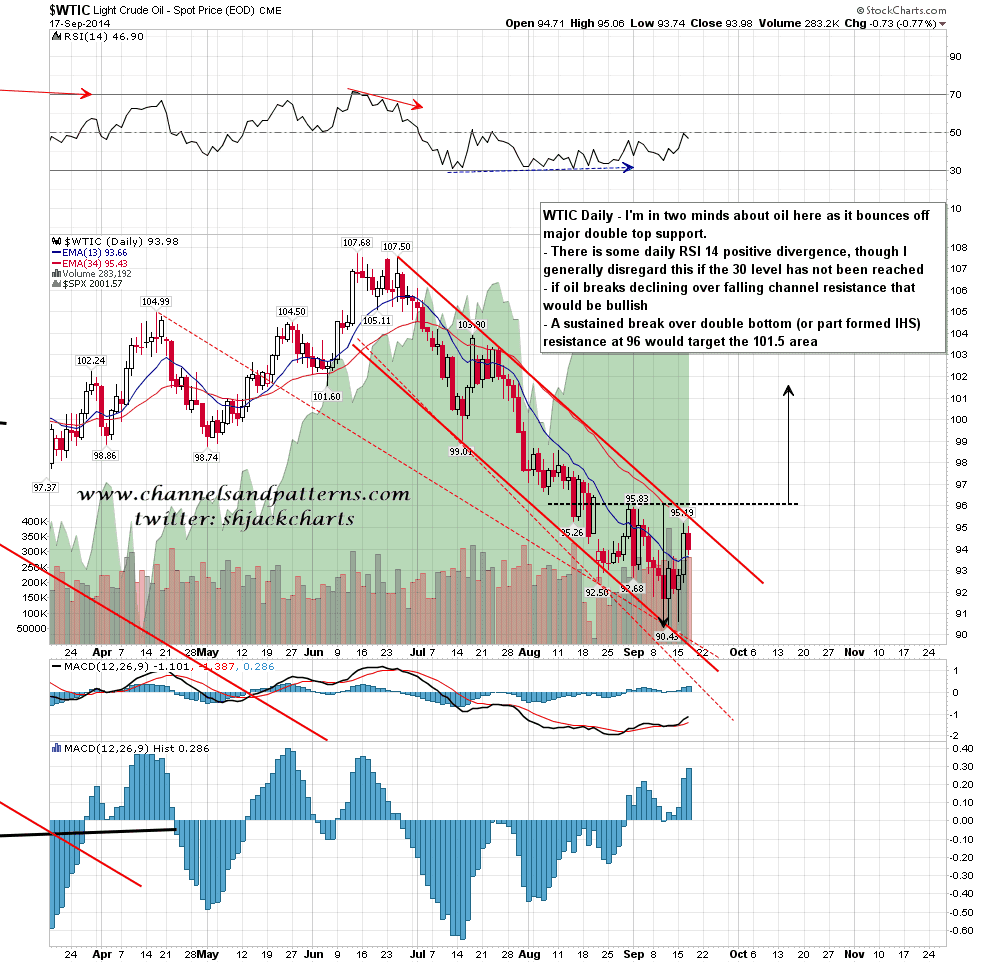
Oil reached my target and main double top support last week and so far is bouncing strongly there. I’m in two minds about what happens next, but if we see a test of 96 then declining resistance from the high will be broken, and if we see a sustained break over 96 then I would have a double bottom target in the 101.50 area. WTIC daily chart:
It seems likely that we will see the all time highs tested again today and if we see a new high I’ll be watching for rejection there. If we see a daily close at or over the SPX daily upper band (currently at 2009) then the chances of an upside resolution here would increase considerably.
