
Well I was saying yesterday morning that I was uneasy about the lack of a retest of Monday’s high and that there was still plenty of scope for surprises between 1935 and 1904 SPX, and we had a very impressive reversal yesterday after SPX made a marginal new low at 1925. That reversal was an amazing 45 points from the morning low to the closing highs, and brought to mind some pleasant hours I spent a while back in Las Vegas getting an adrenal gland workout at the High Roller, which at that time then sported the highest rollercoaster in the world among other terrifying rides. I was sad to read that this was all demolished in 2005, as I would have loved to do that all over again as and when I return to Las Vegas. Las Vegas – High Roller:

What impact has yesterday’s move had on the outlook here? Well it has weakened the bear case very badly, as I had a very high probability daily buy signal trigger at the close yesterday. That is my RSI 5 / NYMO daily buy signal and of the eighteen examples of this signal that have triggered since the start of 2007, sixteen reached the target at the 70 level on the daily RSI 5. The other two failed at the 60 level, but with the daily RSI 5 now just over 50, this is promising some more upside at the minimum, and is leaning towards a strong rally from here. SPX daily chart:
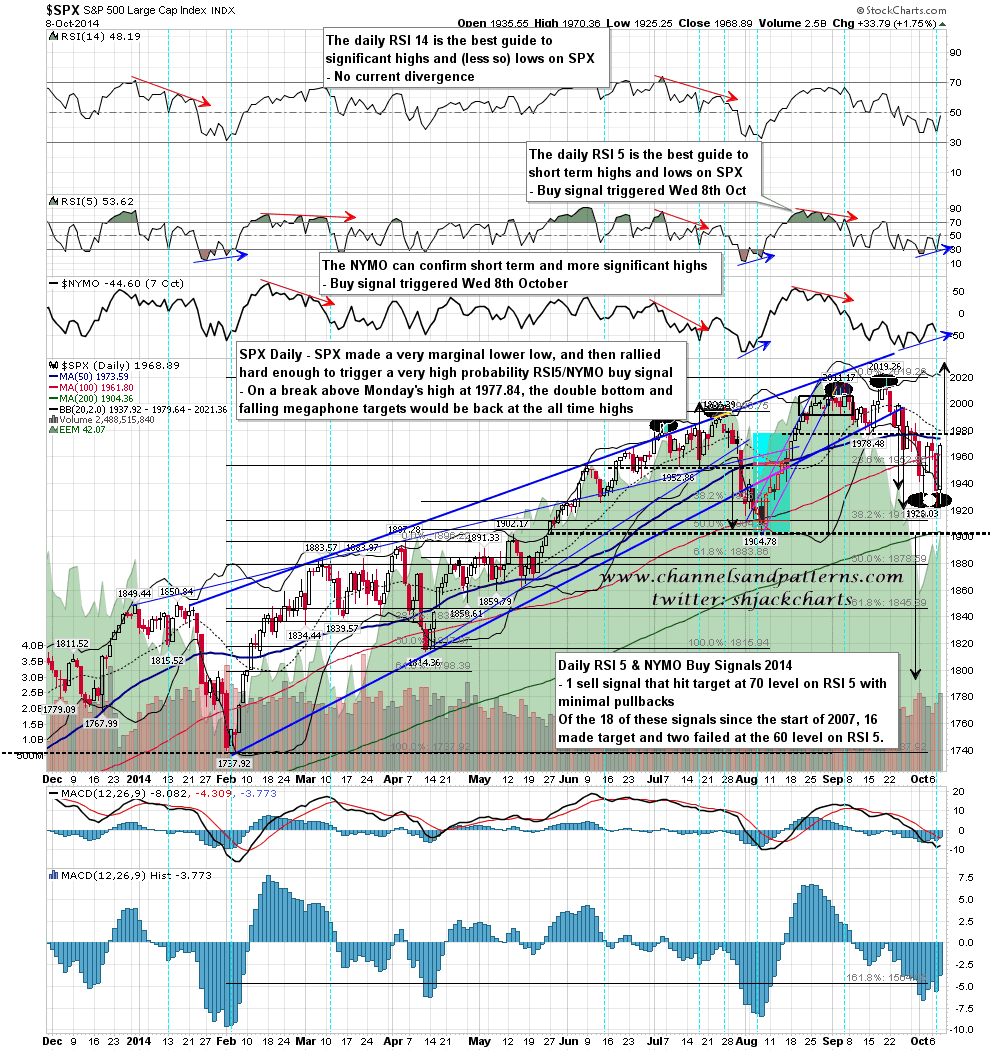
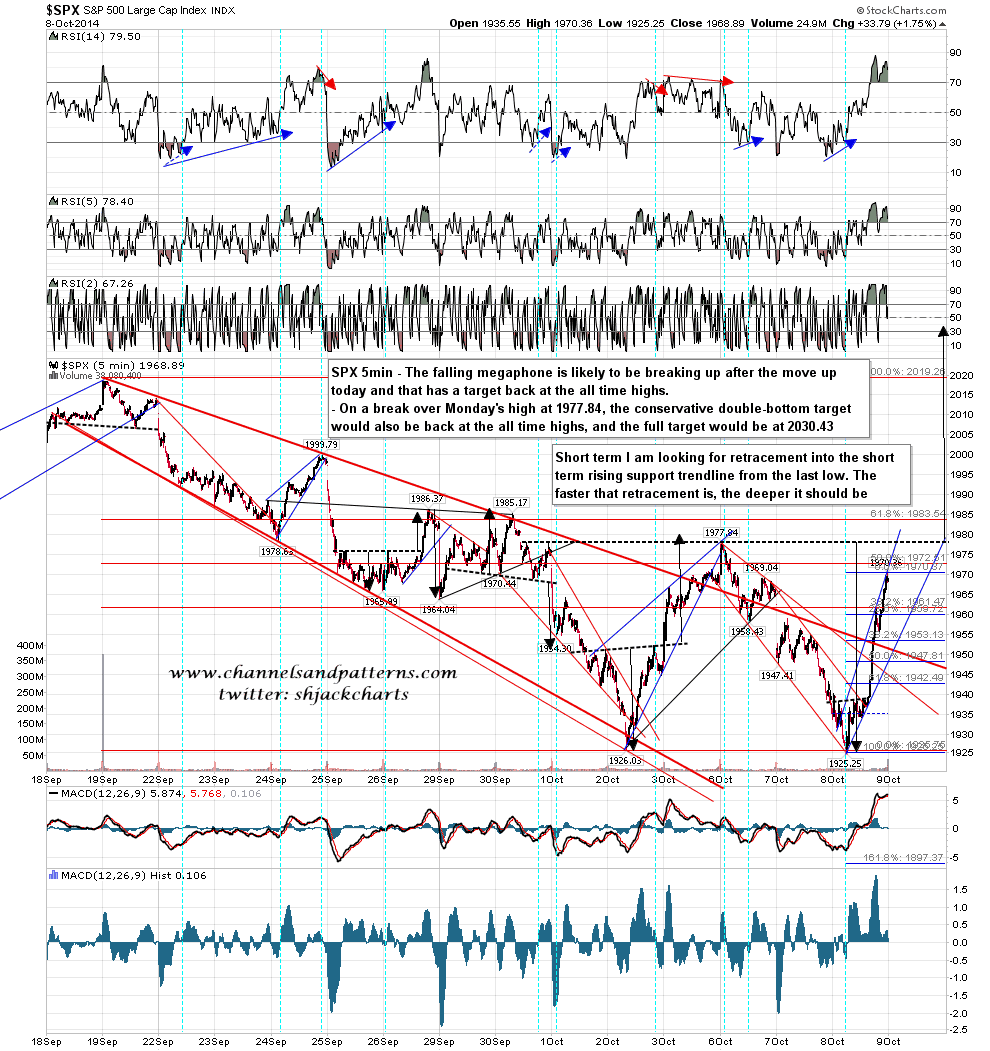
So what is the pattern setup in the context of that daily buy signal? Well with that strong break back over falling megaphone resistance I now have a target there back at the all time high on a break over Monday’s high. On a sustained break over that Monday high I would also now have a double bottom target with a conservative target back at the all time high, and a full target at 2030 SPX. My daily buy signal is telling us that a break over Monday’s high is very likely, and is supporting, with sixteen examples out of the last eighteen, that SPX will make a decent try at testing the all time high next. SPX 5min chart:
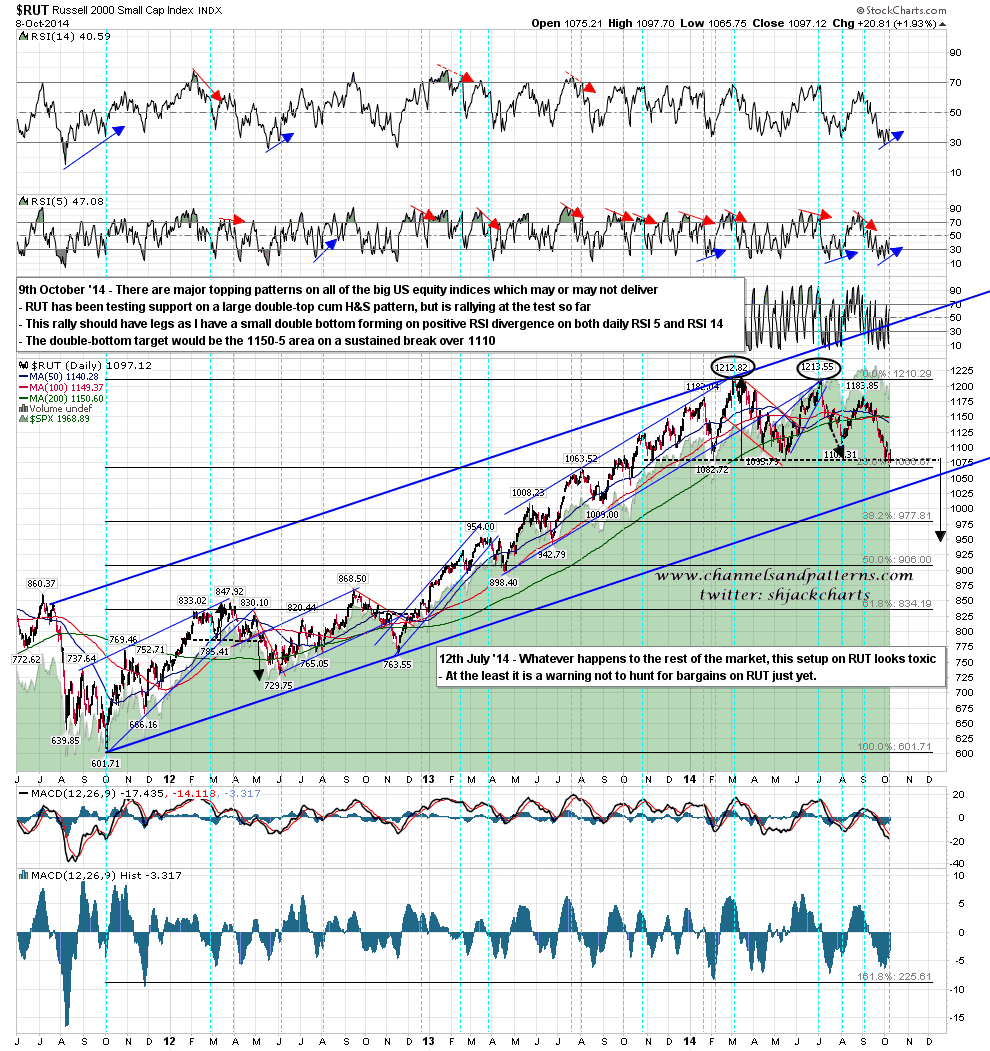
Is there support for that on other indices? Yes, RUT has made a 23.6% fib retracement of the move up from October 2011 and has partly formed a double bottom on significant positive divergence. This chart is now leaning bullish and the double bottom target on a break over 1110 would be in the 1150-5 area. There is still clear unfinished business here on RUT, but for now the outlook has switched back to bullish. RUT daily chart:
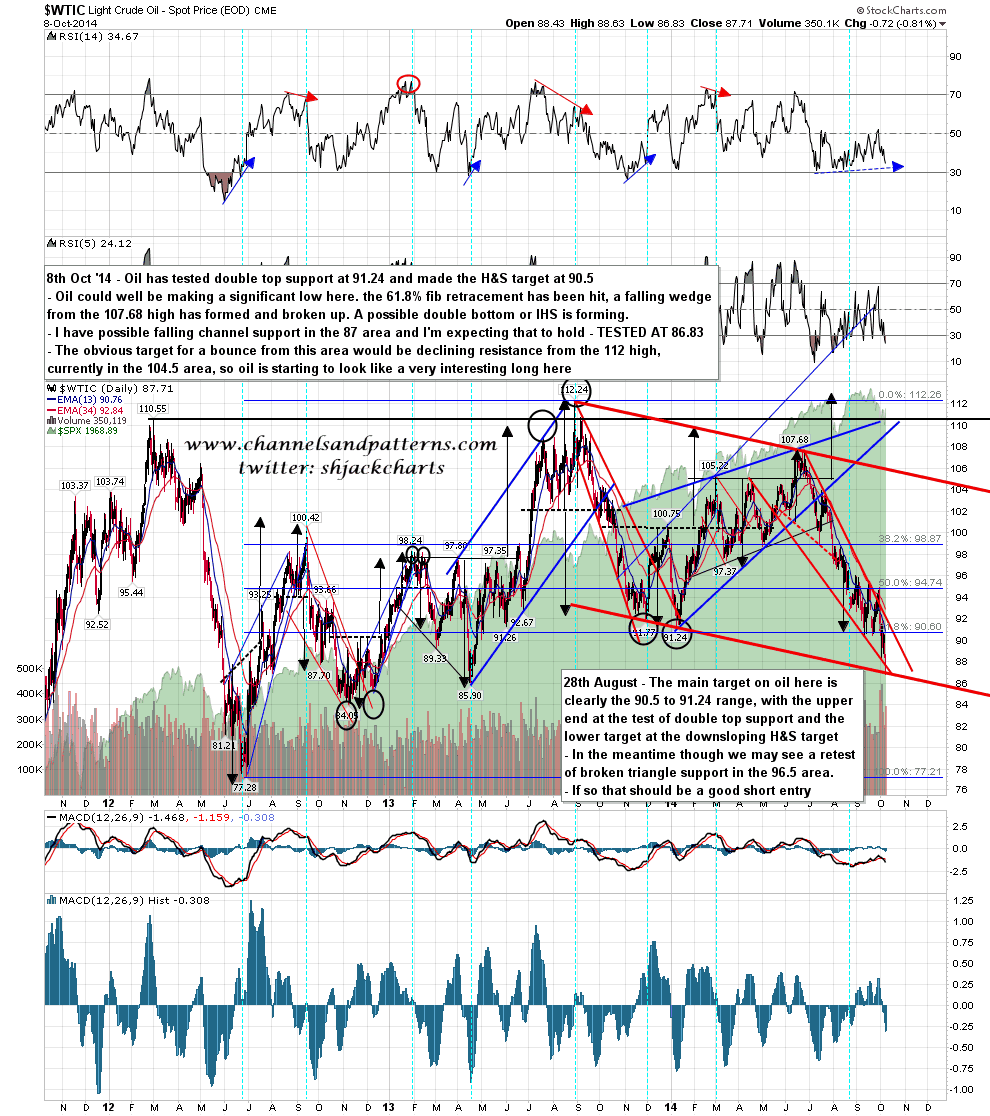
Oil is testing my falling channel support and I am cautiously optimistic that a decent low is forming here. WTIC daily chart:
For today I am looking for some consolidation or retracement with an ideal retracement range at 1947-59 SPX. I’ll be using that retracement to exit short and reverse long. This daily buy signal is not a signal that I would ever fade, and I would suggest at absolute minimum being very cautious on the short side here.
