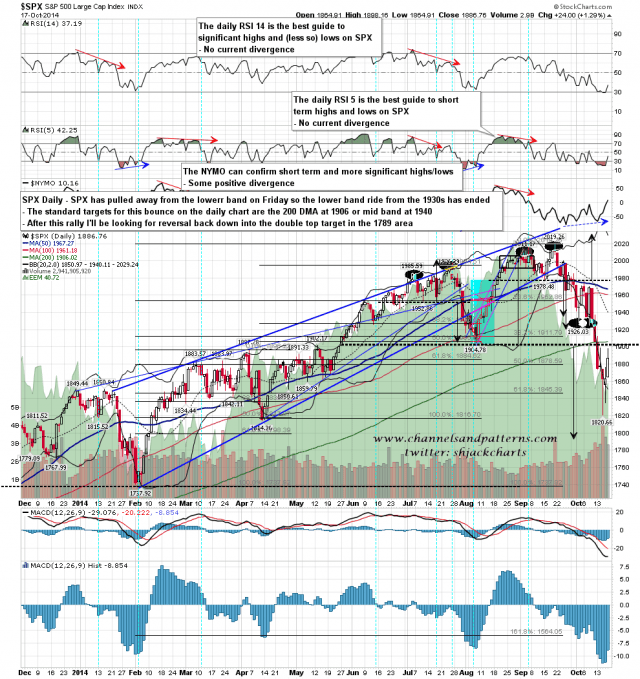
SPX moved away from the daily lower band on Friday and the rally I was looking at is on. The obvious targets on the daily chart are the 200 DMA at 1906 and the daily middle band at 1940. SPX daily chart:
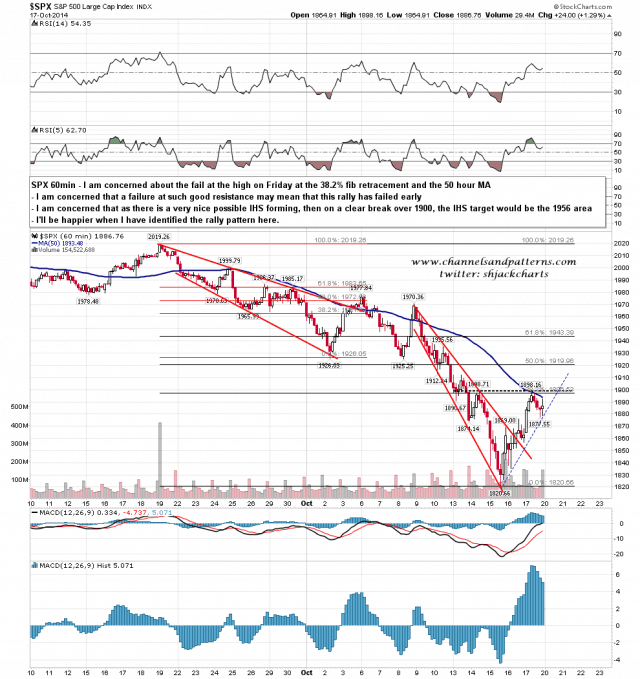
I mentioned the possibility that this rally might fail at the 1898 SPX area on Friday morning, and we have seen a reversal there. I’m a bit concerned about that, as that was a reversal at the 50 hour MA, and a possible IHS neckline. The double bottom target is still the 1920 area, but on a decent break above 1900 there may be an argument for an IHS target in the 1956 area. SPX 60min chart:
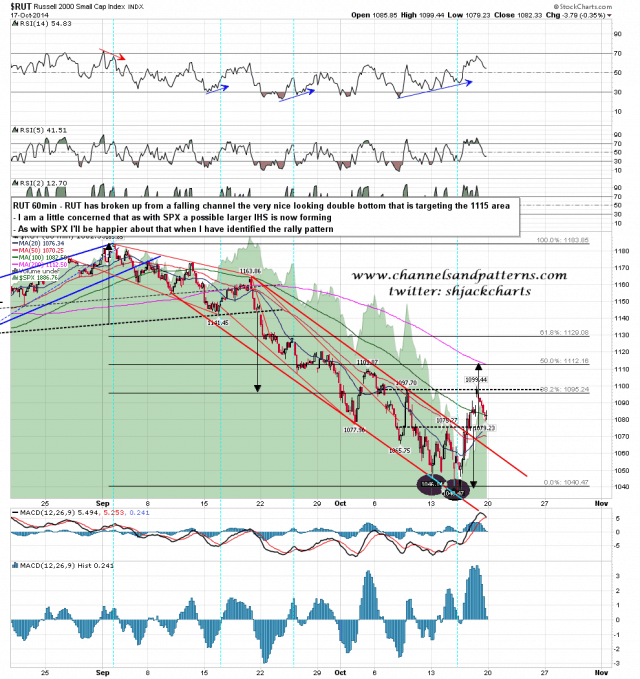
Supporting the rally going further up on SPX are the double bottoms on RUT and TRAN. As with SPX there is a possible larger IHS forming on RUT. RUT 60min chart:
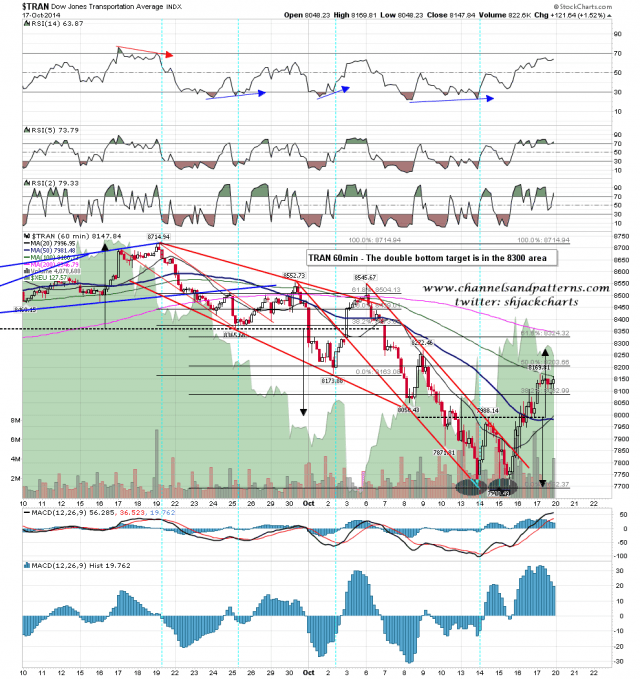
There is no obvious IHS forming on TRAN. TRAN 60min chart:
We may see some more retracement from Friday’s high this morning, but until I see strong evidence to the contrary I’ll be looking for that 1920 SPX target after that. I’ll be keeping an eye on these possible IHS patterns and it should be easier to assess those when the low today is made and I may at that stage then have enough data points to identify the rally patterns.


