
This is a fast and short post as I have to go out soon and won’t be back until a couple of hours after the open.
Obviously my falling channel broke down on Friday and the 2019 support area was broken with very high conviction, with SPX close to a test of the 50 DMA at the close. Both SPX and ES hit the 3 SD (standard deviation) daily lower band at the lows (the normal bands are 2 SD bands), and I’ve been compiling stats for those at the weekend. I’m not all the way through that as there is a lot of data to crunch through, but I have a good feel for the historical probabilities for today from that.
First though I would note that the SPX low on Friday was at 2002.33, just above the November low at 2001.01. SPX has only broken the November low in December in nine years since 1970, mostly in bear markets, and hasn’t managed it at all in the last ten years, so that is strong support until it is broken in trading hours. If that support holds then we won’t see more than a test of the SPX low today before the Xmas rally begins.
The remainder of the stats today depend on that Nov low support being broken, and if it is then there are strong stats from the historical hits of the 3 SD daily lower band that I’ve been compiling on ES (March).
I’ve written up more that 70 of these so far, and by the time I have run this all the way back to 2000 I’ll most likely have over 90. Of those hits all but one rallied the next day to at least test the 2 SD daily lower band, and that one exception was in any case the short term low before a rally back over the middle band. I posted that stat on twitter last night and we have already since seen that rally.
Over those hits I have written up 11 so far that closed the daily candle at or near the low of the day, and of those 7 tested the 3 SD daily lower band again the next day. The odds therefore favor a move there today and that is currently at 1982 ES March.
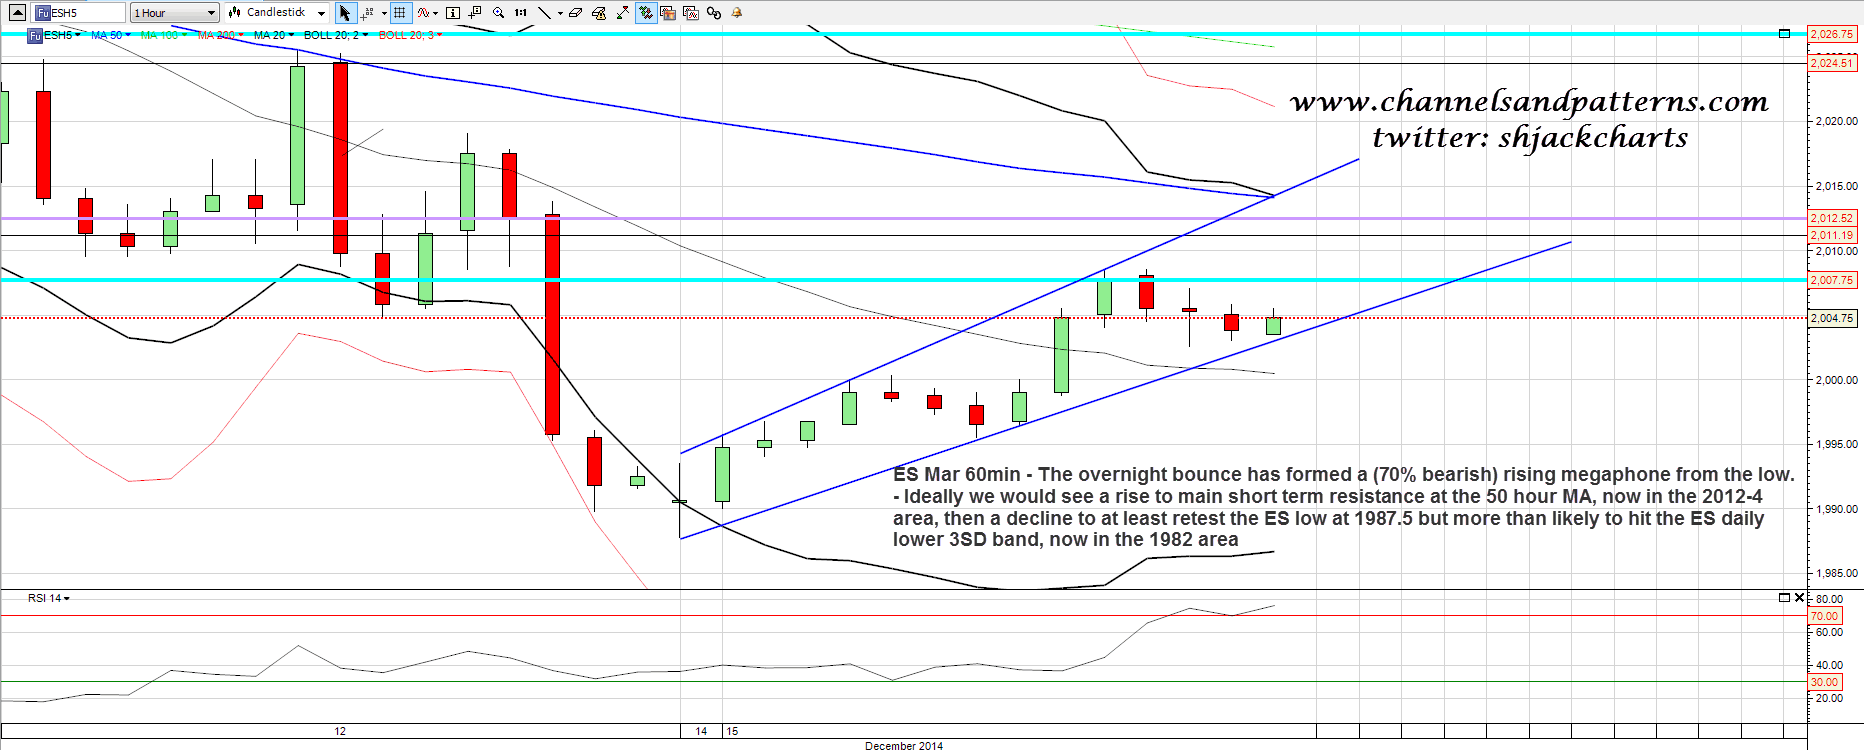
My ideal scenario for today would therefore be a rally into the 2012-4 area to fail at the ES 50 hour MA, then a decline to test the 3 SD daily lower band in the 1978-82 area, and then very possibly make the December low there to start the usual Xmas move up, with a target at new highs, as the historical stats still strongly favor that here. ES 60min chart:
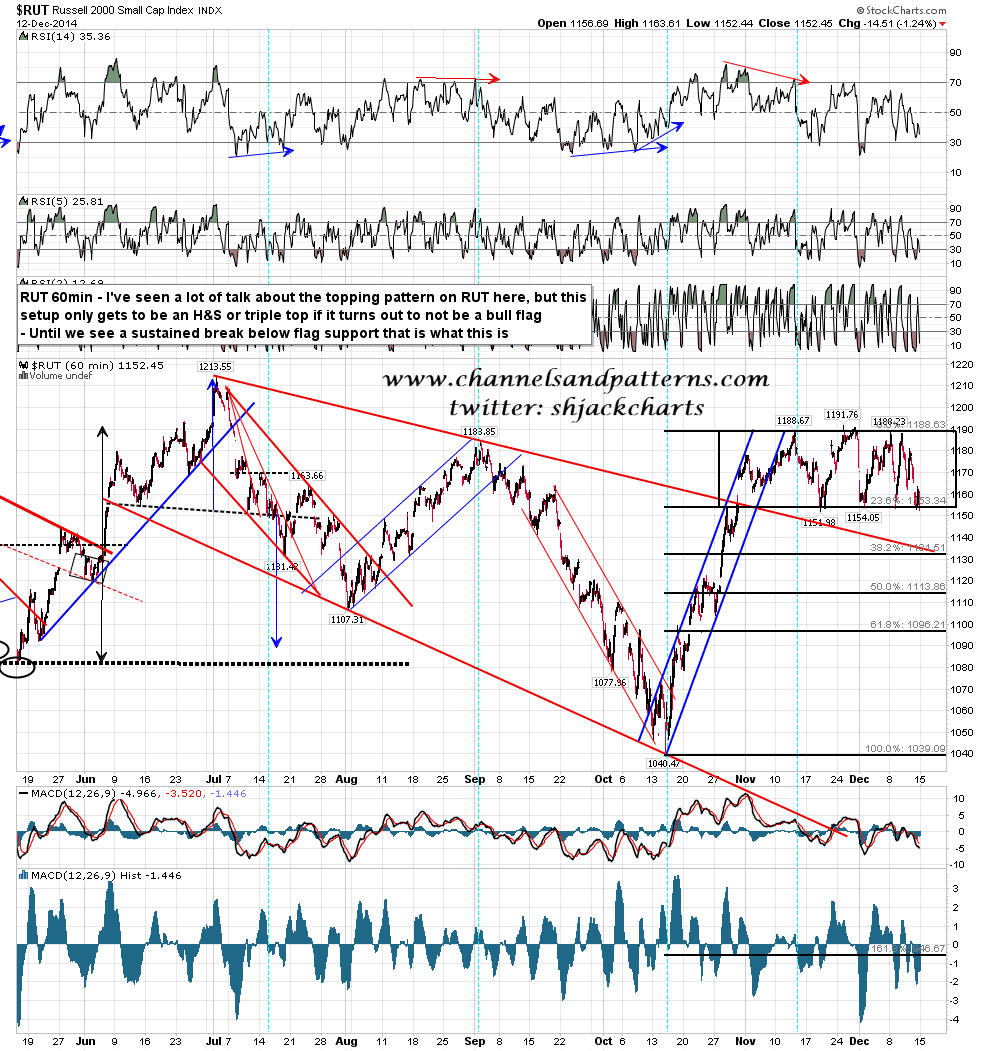
I’ve been reading a lot about the H&S (or double-top) on RUT, but seriously, just look at it. 23.6% retrace and a sideways range at the top of a tight upward channel. This has to be assumed to be a bull flag until we see a sustained conviction break below flag support. We have not seen any such break as yet, and I strongly suspect that we won’t. RUT 60min chart:
Unfortunately I have to be out the first couple of hours today, which is very bad timing, but that’s the way it goes. I’ll be cautiously trading my ideal scenario for today by remote.
