
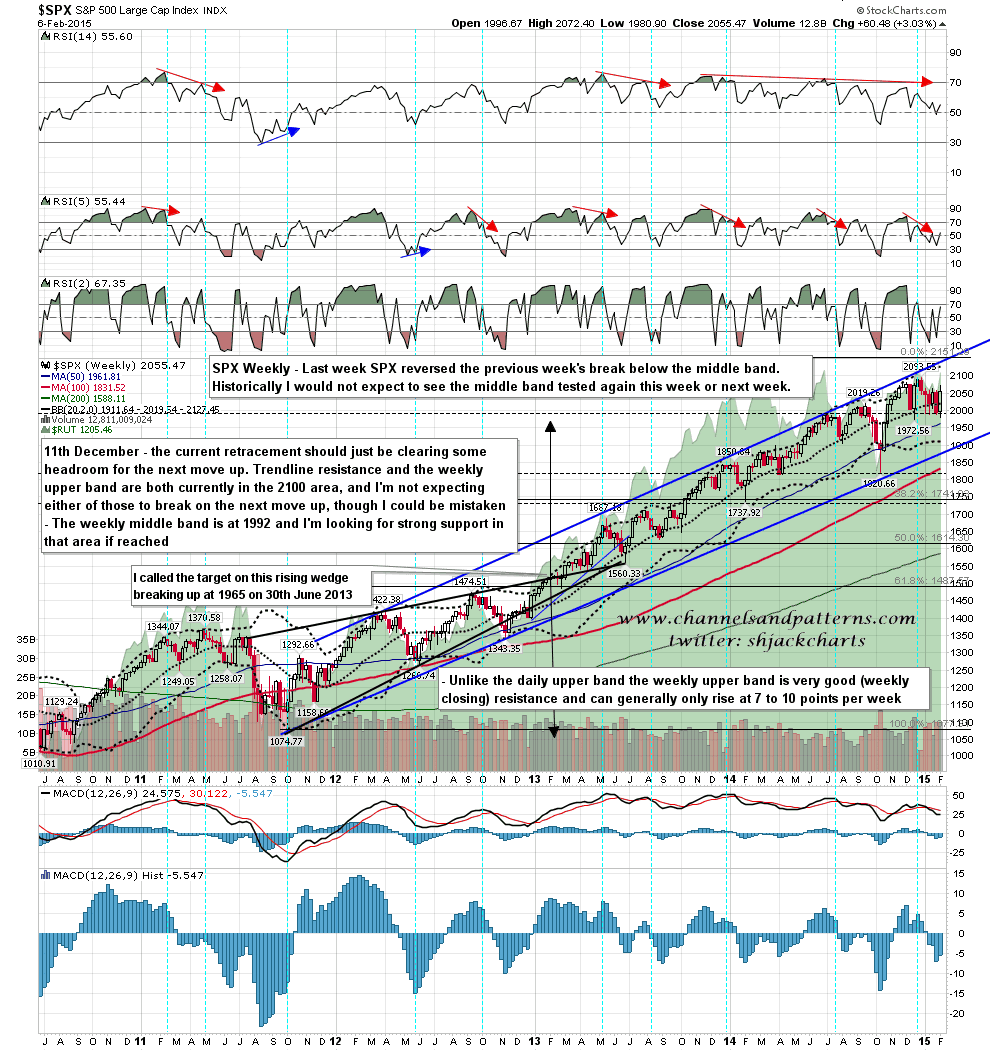
The first thing to say today is that though Friday had much to please the bears, the weekly candle did some serious technical damage to the bear case for the next couple of weeks at least. That’s because the candle reversed the break below the weekly middle band of the week before, and while it’s possible that might be reversed again this week, that would be rare, and the odds strongly favor a flat to up week this week and a move significantly higher than Friday’s high by the end of next week. While I’m looking for some downside early this week, that may be very short-lived. SPX weekly chart:
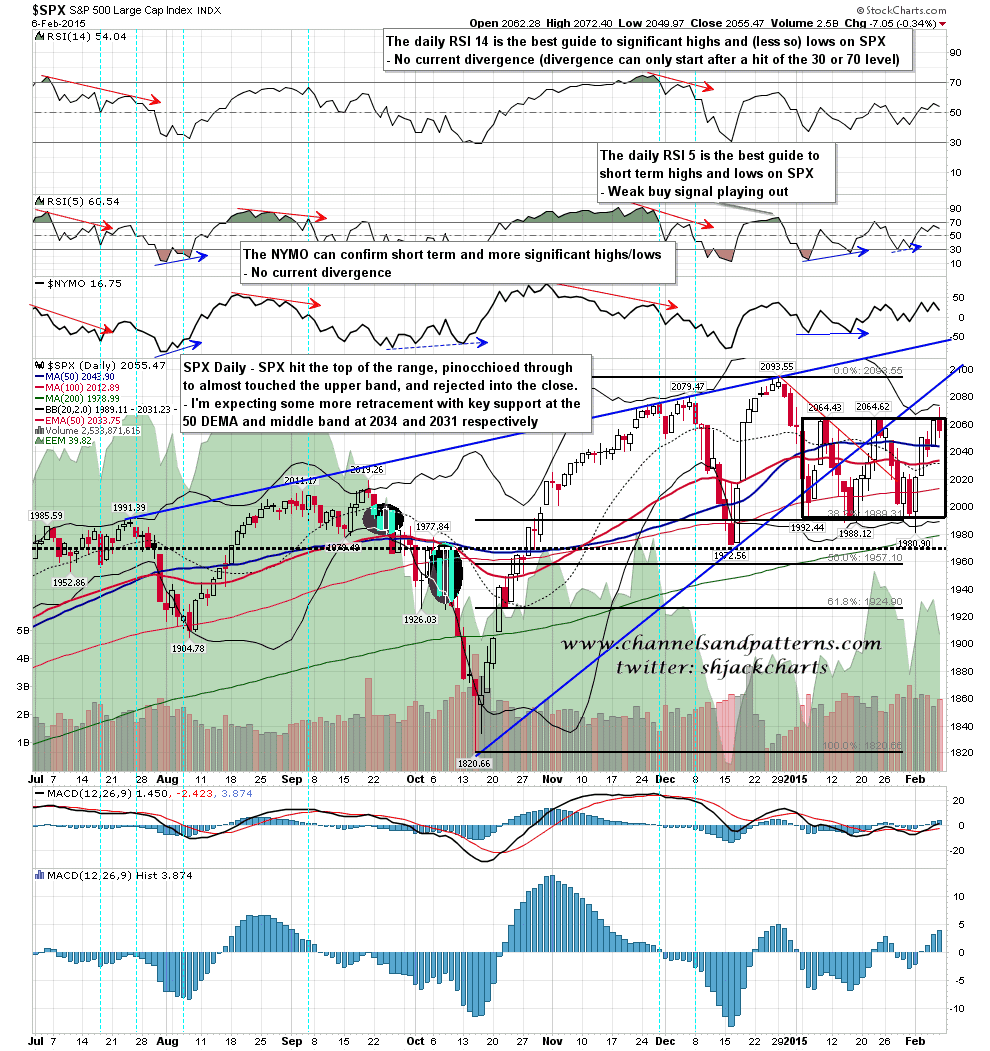
On the daily chart SPX reached the top of the range and pinocchioed it slightly to make the IHS target at 2069. There was then rejection and the close was back well within the range. I would expect some follow through on the downside today and would expect a test of the 50 DEMA and the middle band in the 2031-4 area, most likely today. SPX daily chart:
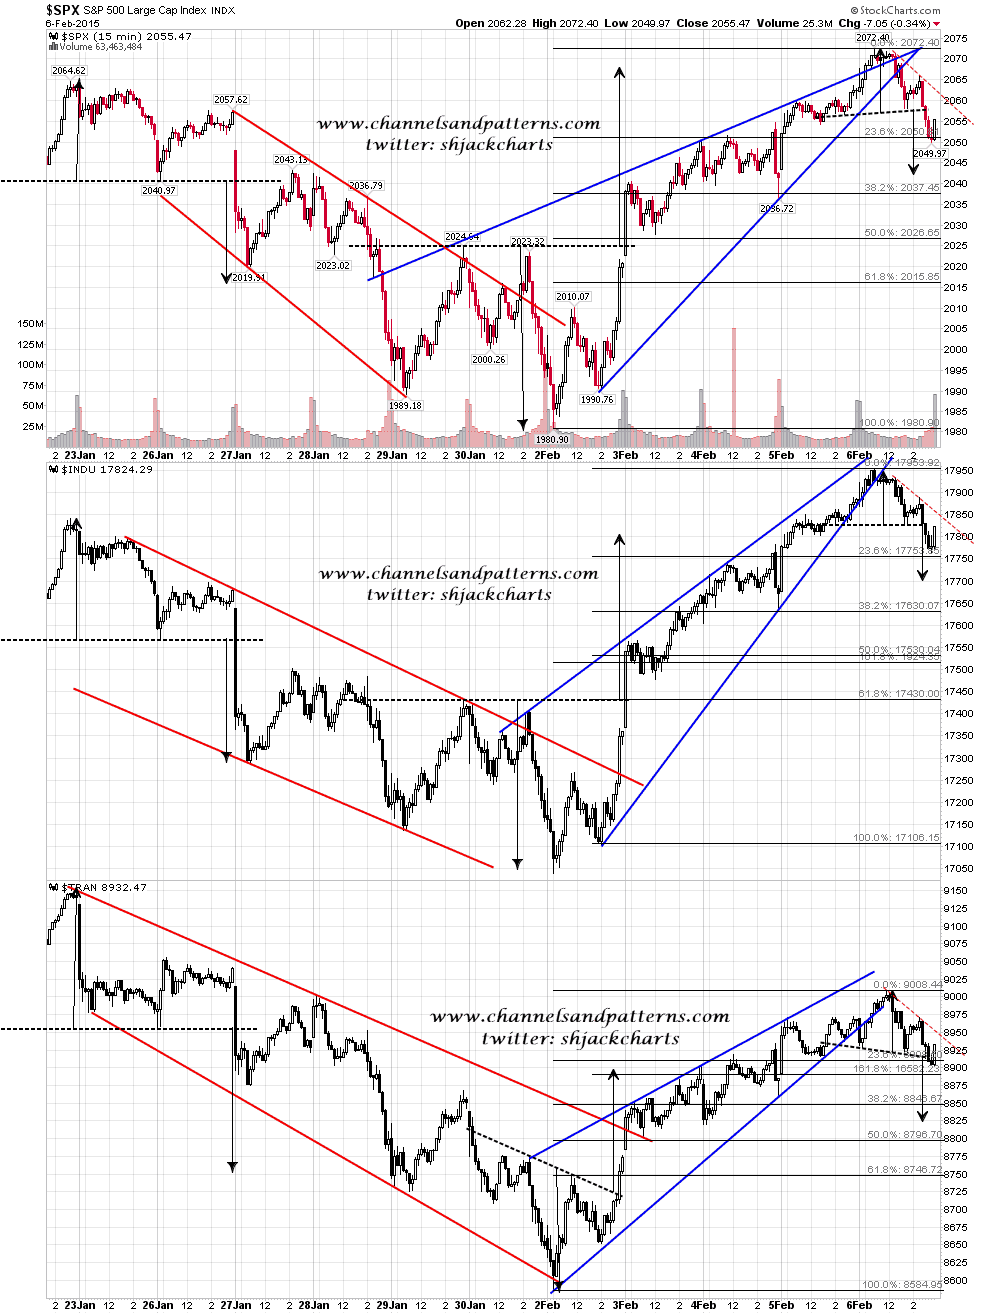
All the rising wedges that I was looking at on Friday morning broke down in the afternoon and all of them formed H&S patterns that were looking lower. The H&S target on SPX is in the 2042 area, but I’m expecting a bit lower to test the daily middle band. 3x chart screen 15min SPX INDU TRAN:
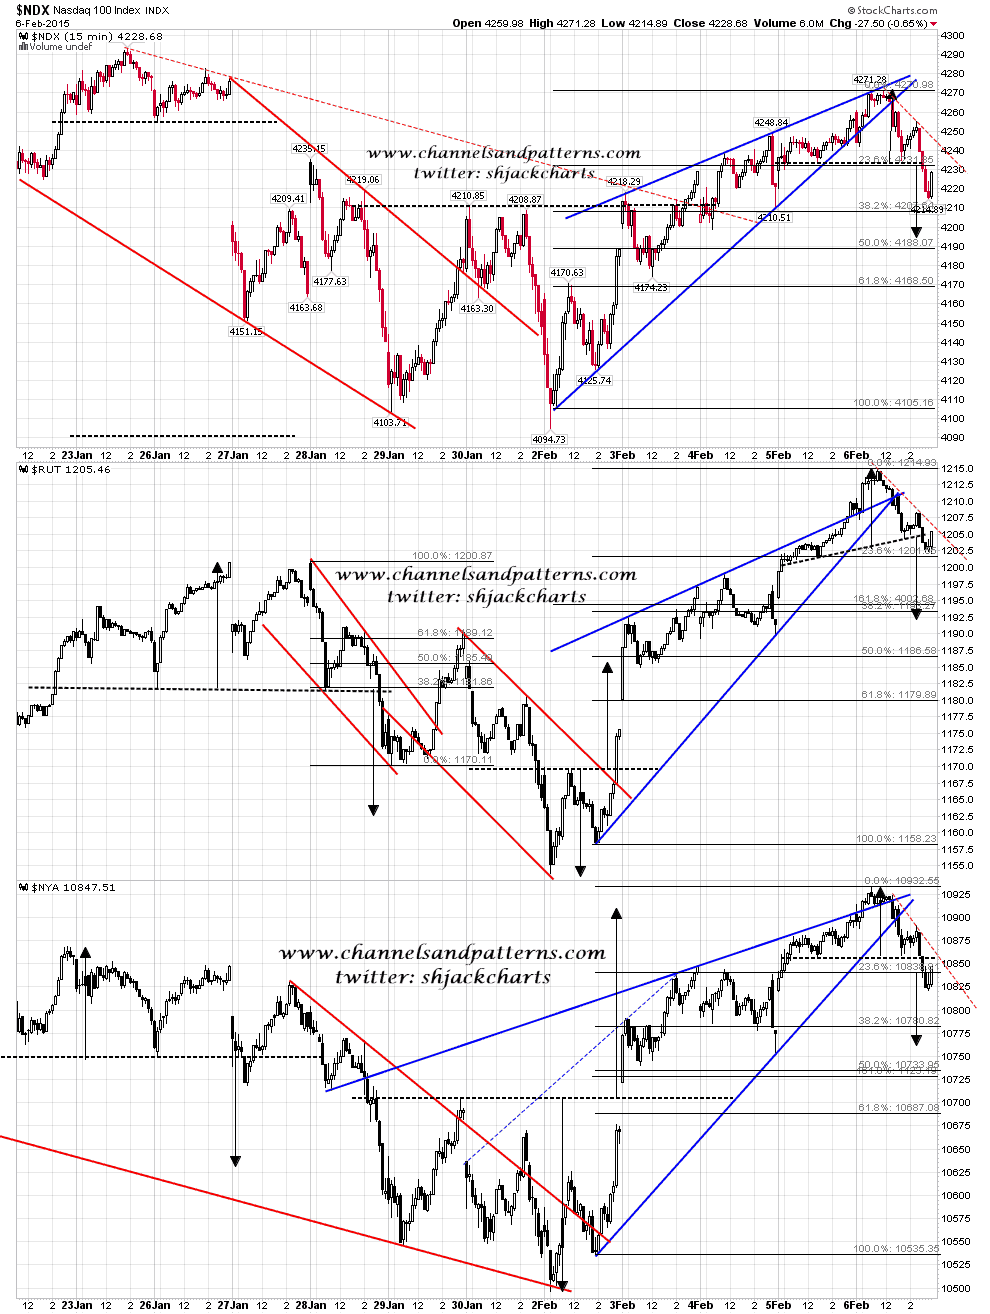
All of these H&S patterns broke down on Friday afternoon and none of them have made target yet. 3x chart screen 15min NDX RUT NYA:
The key test for today, if seen, is the test of the daily middle band on SPX in the 2031/2 area. If bears can break back below that and sustain that break then that opens up another possible test of the range support area around 1990. The weekly candle from last week however is telling us that the SPX daily middle band will most likely hold, and that we may well see a test of the all time highs at some point in the next few days, though I’d expect that test to make the second high on a double top.
