
The rising wedge I was talking about yesterday morning broke down and retested during the day. We are likely to see some retracement here and possibly a significant high. If we are looking at a retracement my minimum target area is the 23.6% fib retrace in the 2073 area, but my usual target range would be the 38.2% fib at 2055, the 50% fib at 2041 and the 61.8% fib at 2026. I would note that the daily middle band closed yesterday at 2053, so we might see a retest of the daily middle band. SPX 5min chart:
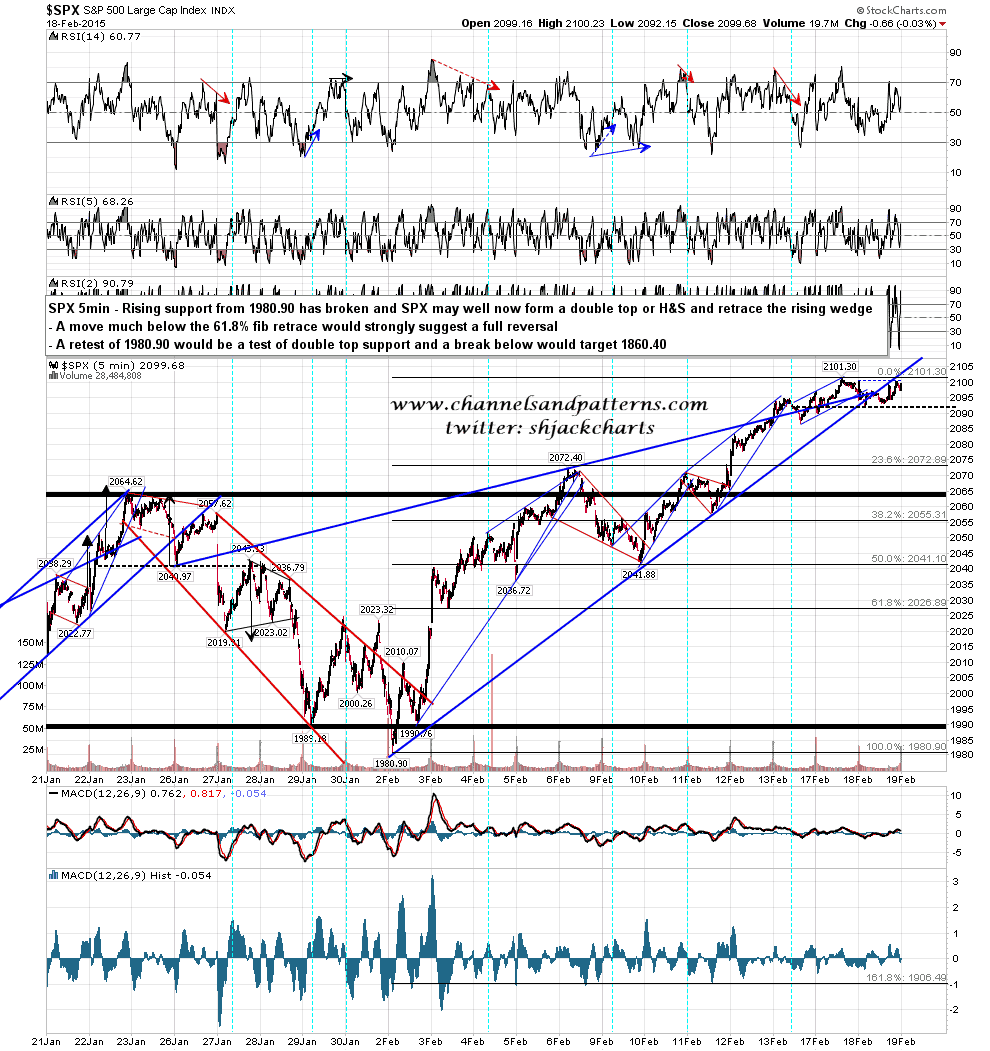
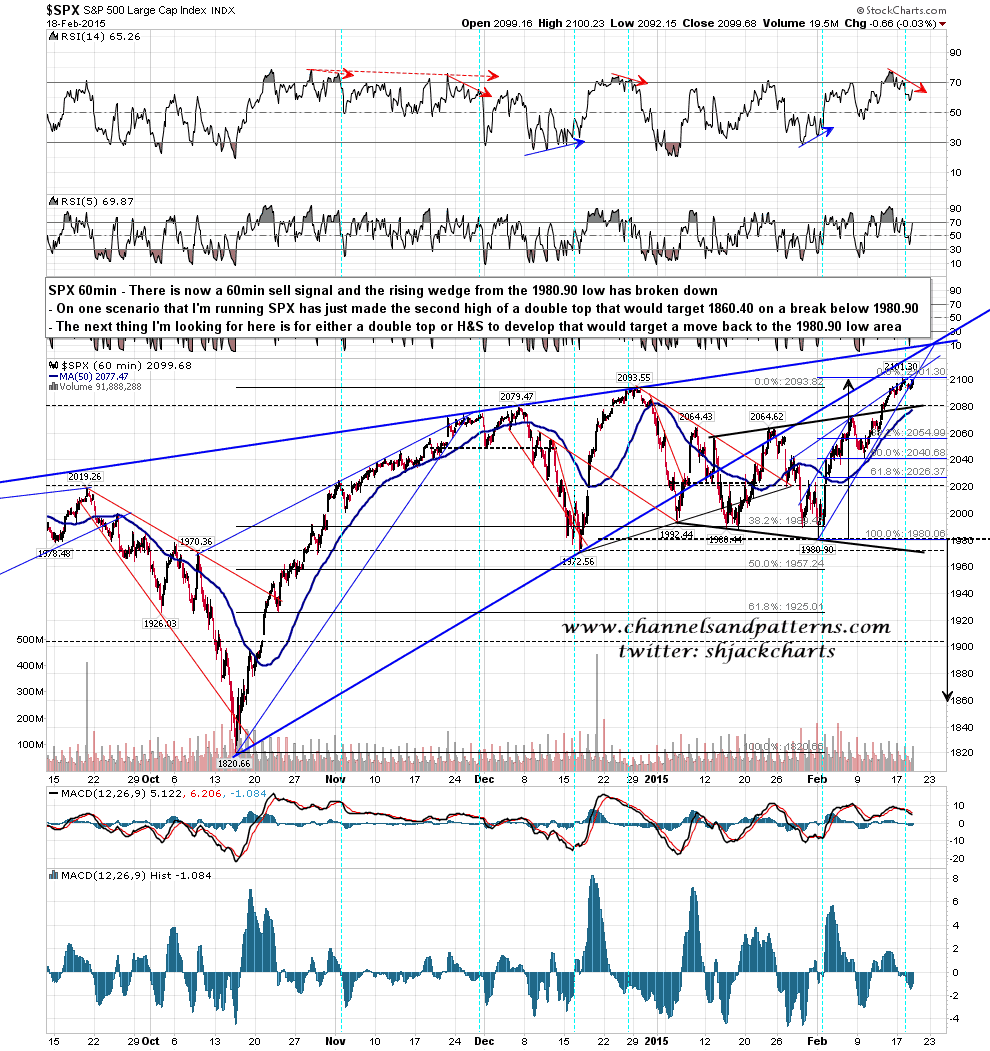
If we were to see a full reversal here then I have a scenario where SPX has just made the second high of a double top that would target 1860.40 on a break below 1980.90. I’ll be upgrading that scenario if we see a clear break back below the daily middle band. I have a 60min RSI 14 sell signal triggered yesterday which is strongly suggesting retracement here. SPX 60min chart:
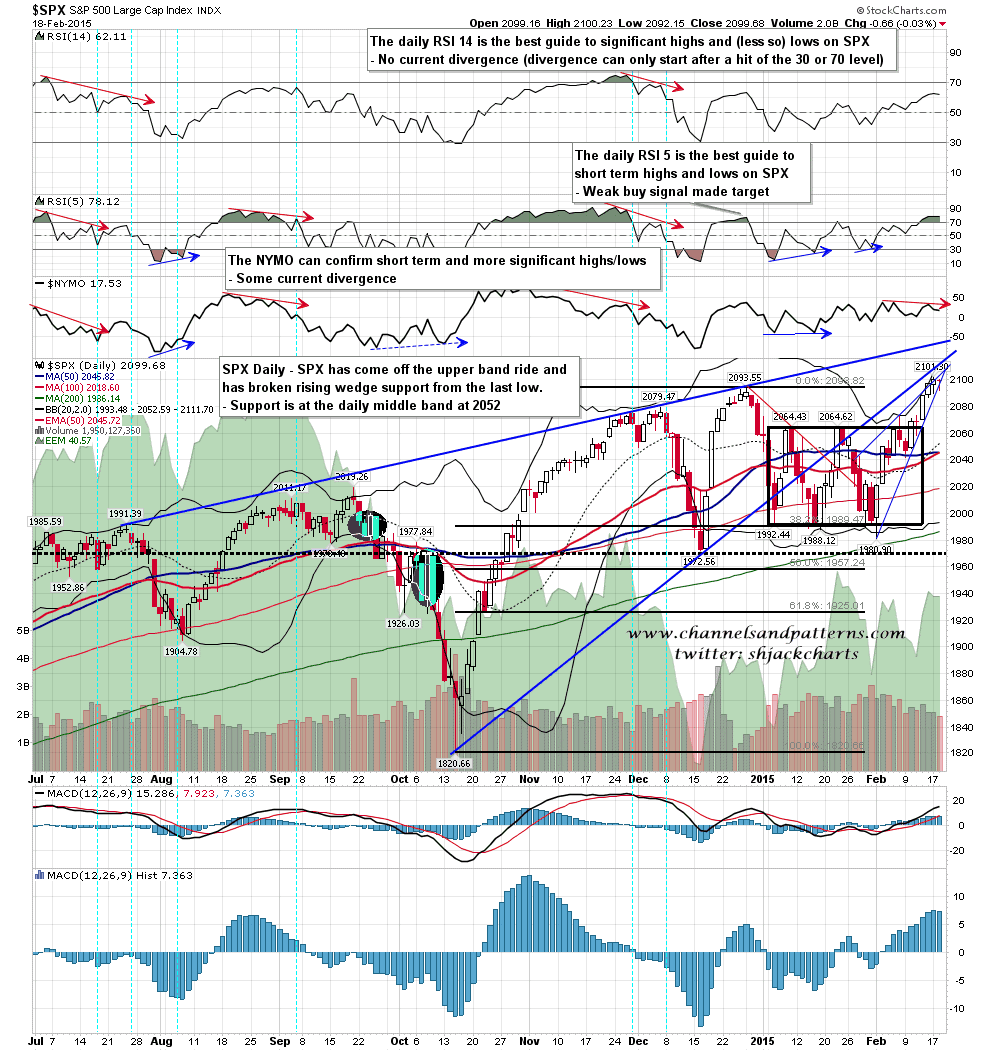
On the daily chart the RSI 5 is oversold but as there has been no pullback there is no negative divergence. There is some negative divergence on NYMO but unless we see a serious break of support then I’ll be assuming this is just a retracement before another push up. SPX daily chart:
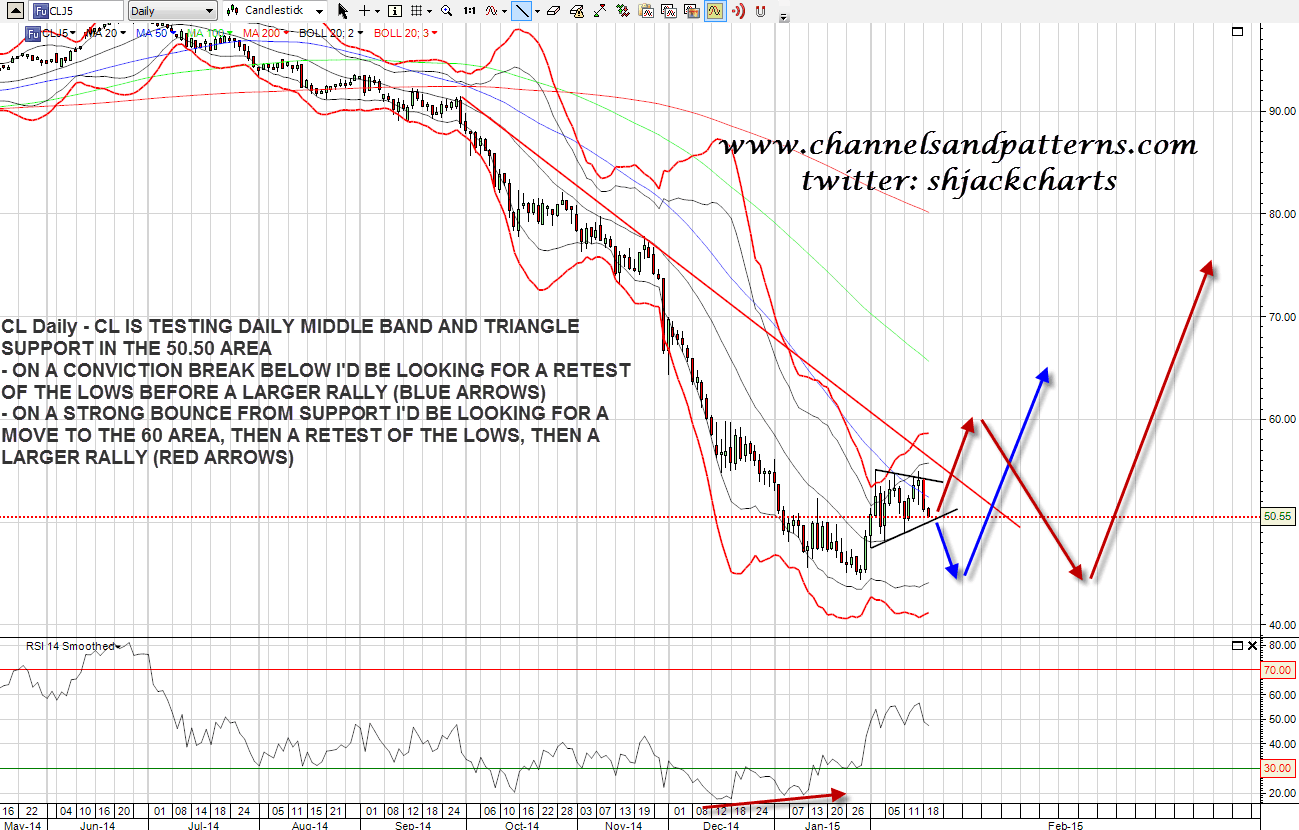
CL is at an inflection point here testing triangle support and the daily middle band. If it breaks down I’ve sketched out the path I’d be looking for in blue arrows. If CL bounces at support here then I’ll be looking for the path I’ve sketched in red arrows. CL daily chart:
My lean is bearish looking for at least a test of the 50 hour MA at 2077 area with the 23.6% retracement at 2073. If we see a break down below that area I’d be looking for the 38.2% fib retracement area around 2055.
