Instead of a video, I just thought I’d share a few charts tonight.
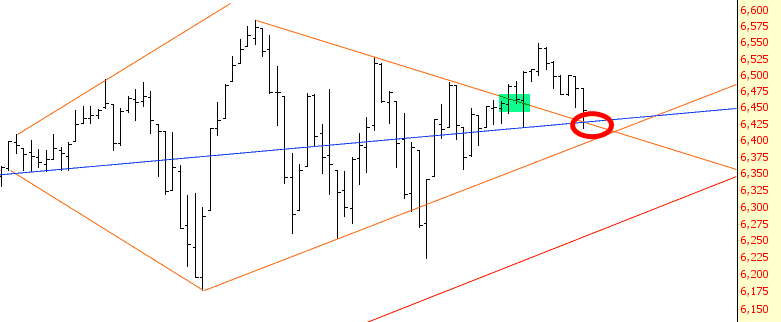
Our deceased Ichthus chart is still one I am following with interest (this is, as you’ll recall, the Dow Jones Composite). The breakout is tinted in green. We have retraced to the pattern and, naturally, my fondest wish is that we break it down to the downside.
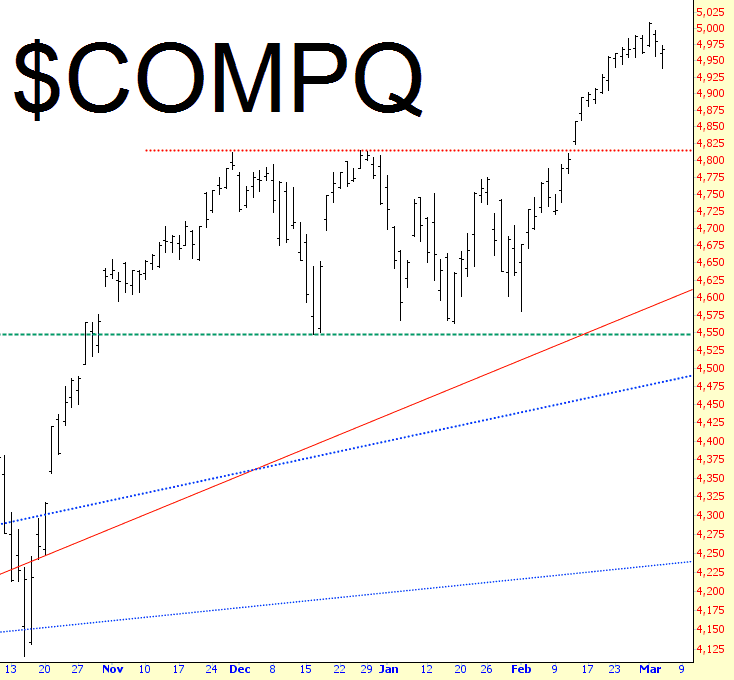
A different “composite” – the NASDAQ – had all the bulls giggling and tittering and scampering around a couple of days ago when it closed above 5,000. Indeed, all five of the top five stories on MarketWatch that afternoon were about this “5000” milestone (which should have pretty much told you something right there). A general point I want to make about all these charts is this: even if the bull uptrend remains completely unbroken, there is still plenty of opportunity to the downside before major support is found.
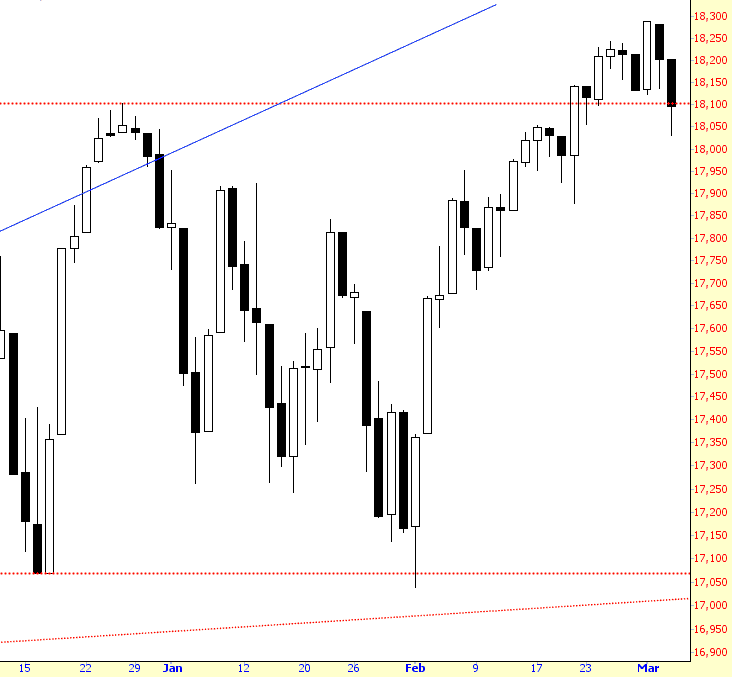
The Dow Industrials is right at the cusp of a failed bullish breakout. Indeed, its close is just beneath the breakout, so strictly speaking it has already failed.
To my earlier point, the S&P 100 could fall as low as 873 (over 5%) without violating its bullish breakout.
The Transports, helpfully, have maintained their series of lower lows:
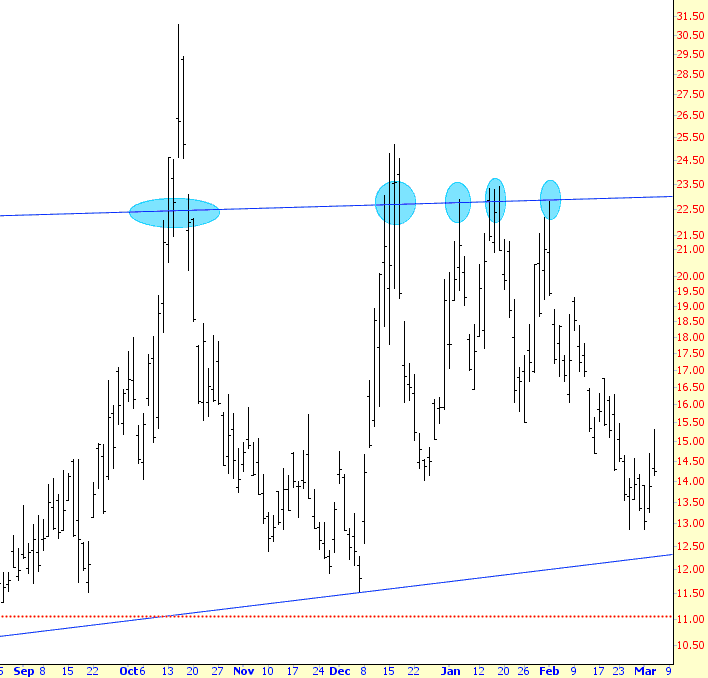
And, frankly, we remain very “due” for another blue dot. It’s been quiet. Too quiet. Prepare ye the way of the gourd.
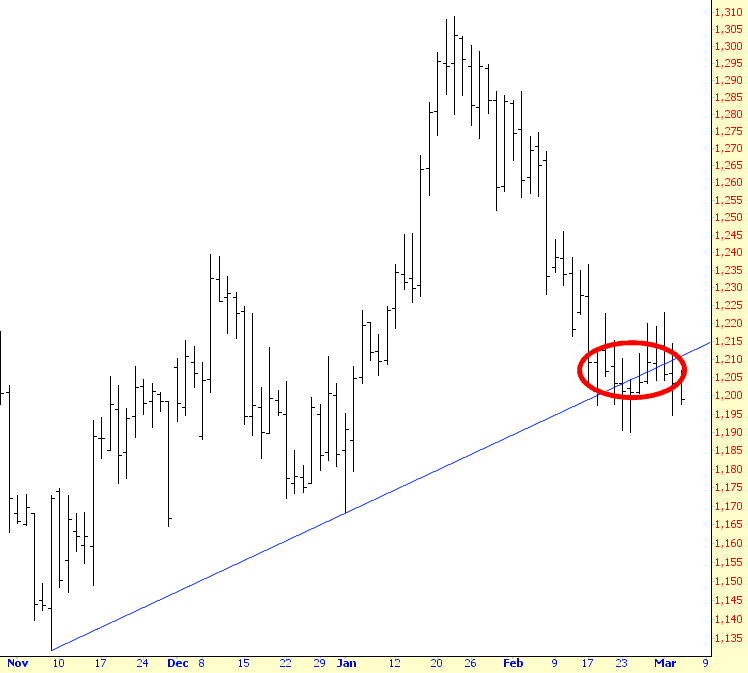
Oh, and finally, as for gold – – – the damage is done. This poor, broken beast is just going to keep getting weaker.


