
Before I begin, a quick remark to my beloved Slope+ subscribers: please note the idea from this morning is slightly updated, so check it out, and the post about the Euro later in the day – – well, phew, glad we got out in time. Now, on to the one chart of this post…….
Here’s an intraday chart of the ES going back about ten weeks or so:
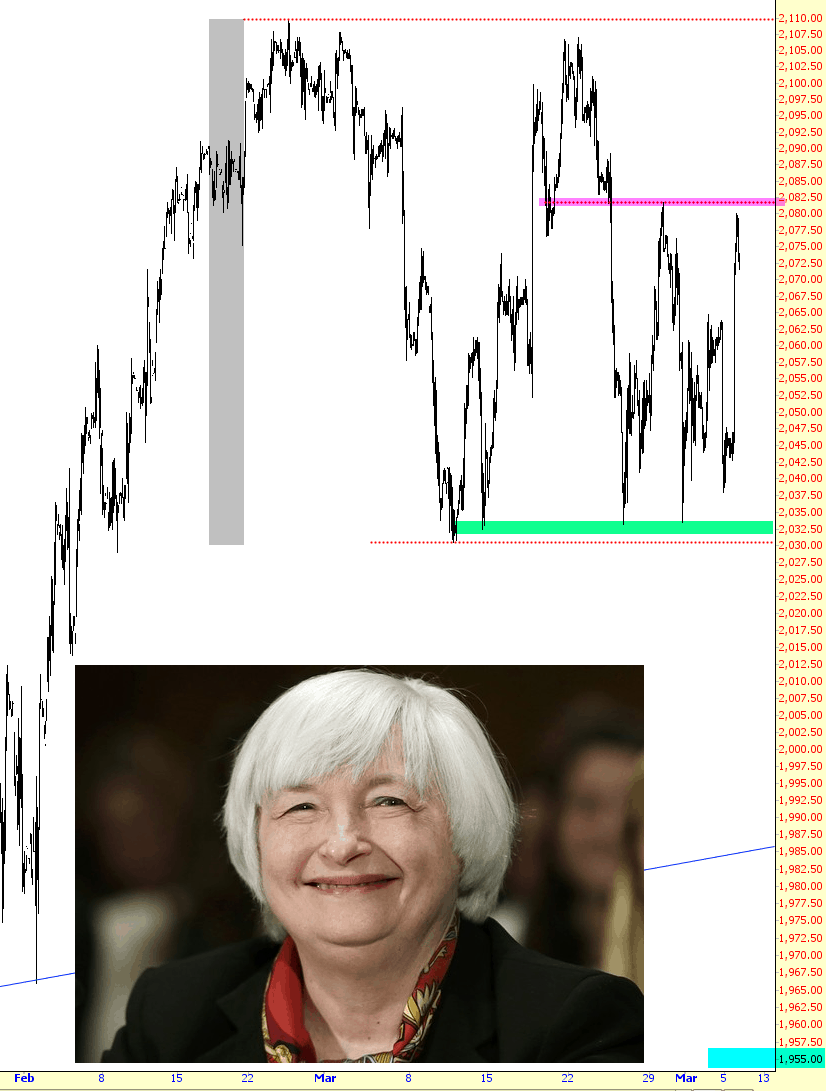
Simply stated:
- There seems to be decent resistance about 2082, tinted in magenta;
- There is clearly firm support at about 2032 (which we challenged yet again during Friday’s brief sell-off, only to roar higher today toward resistance); this is tinted in green;
- The overall range we’ve been in during the past ten weeks or so is about 80 points, tinted in grey;
- A firm break of support should send us toward that blue supporting trendline and, possibly, pushing below the lows this year to a target of about 1955
And that’s all there is to that! As for me………back to my Cool Project.
