
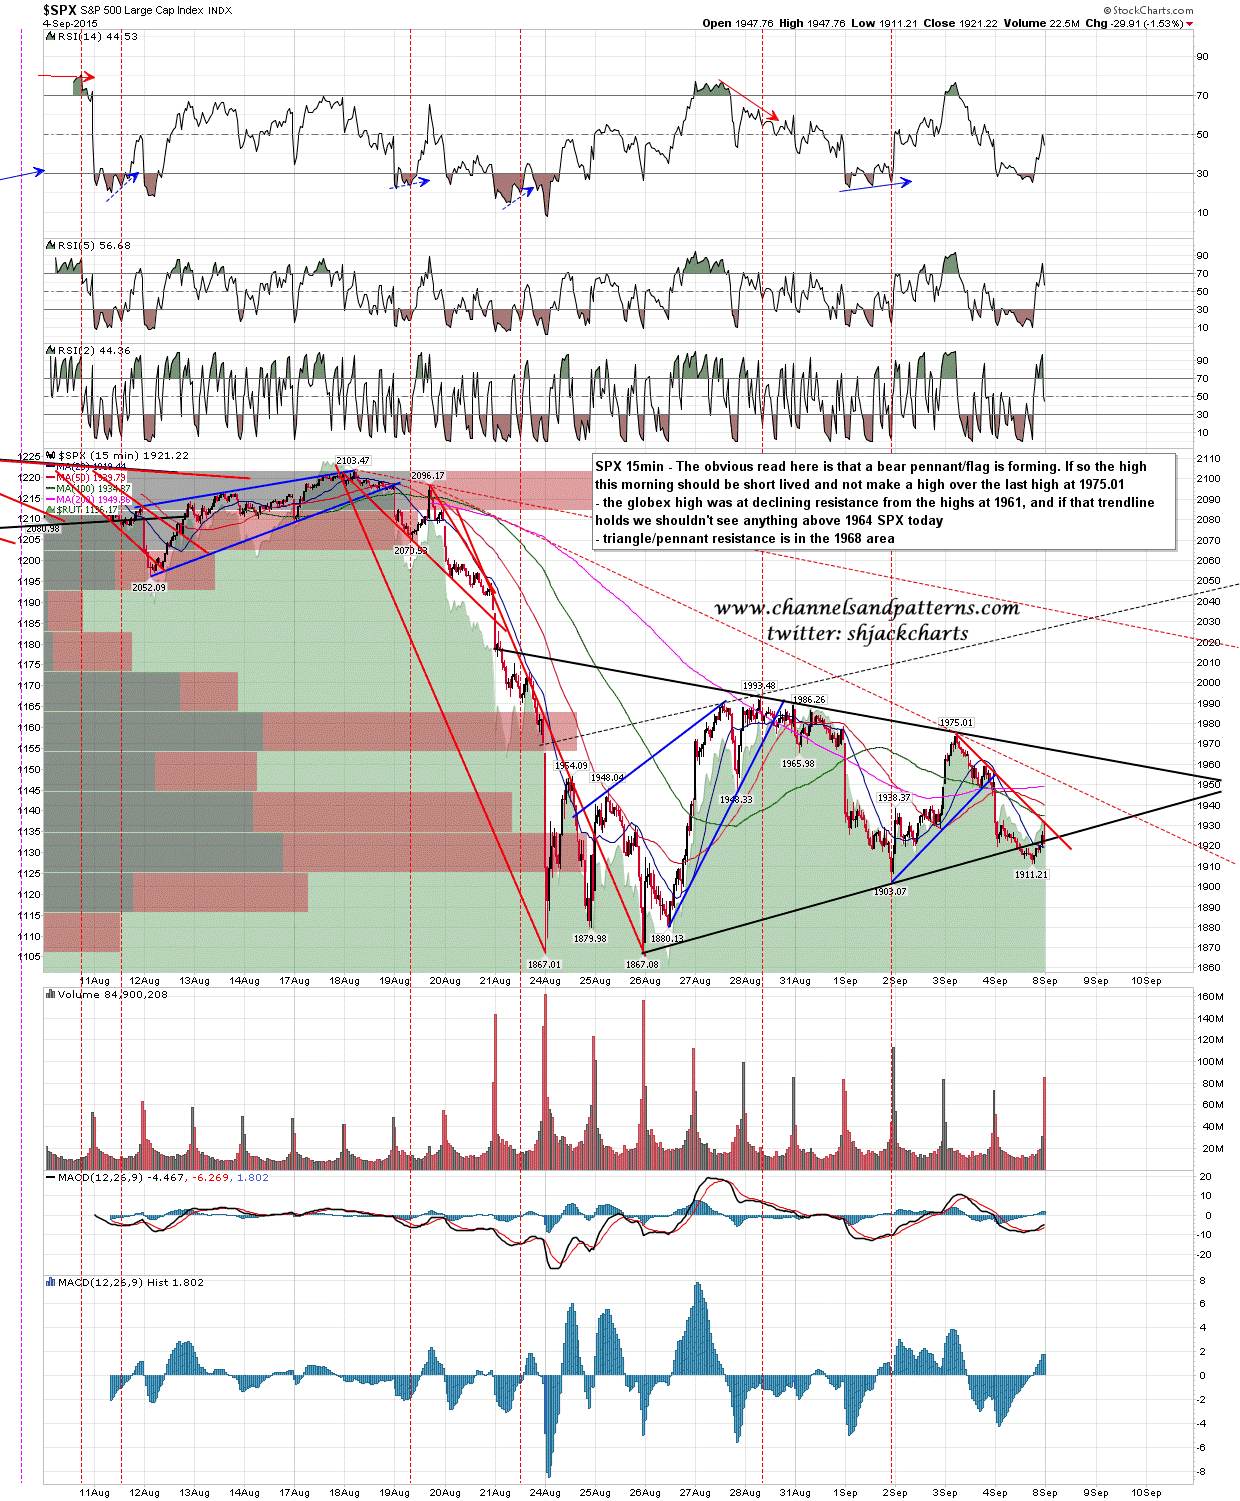
The very obvious read on the SPX moves over the last few days is that a bear pennant is forming. These are triangles that act as a kind of bear flag. These generally break down, hence the name, and this one should very much break down too.
If this big gap up this morning is to test triangle resistance then that is in the 1968 area, but we may well not see anything over the overnight high in the 1964 SPX area (1961 on ES globex), as that was a hit of declining resistance on ES from the highs. If both those levels are broken that wouldn’t be that unusual, as triangle trendlines tend not to hold well, but if it is reversing soon then SPX should not go over the last high at 1975.01. SPX 15min chart:
If 1975.01 is broken then the obvious next target would be a test of the daily middle bollinger band at 2006 (and falling fast). A daily close over that would open up a test of 2030-40. SPX daily chart:
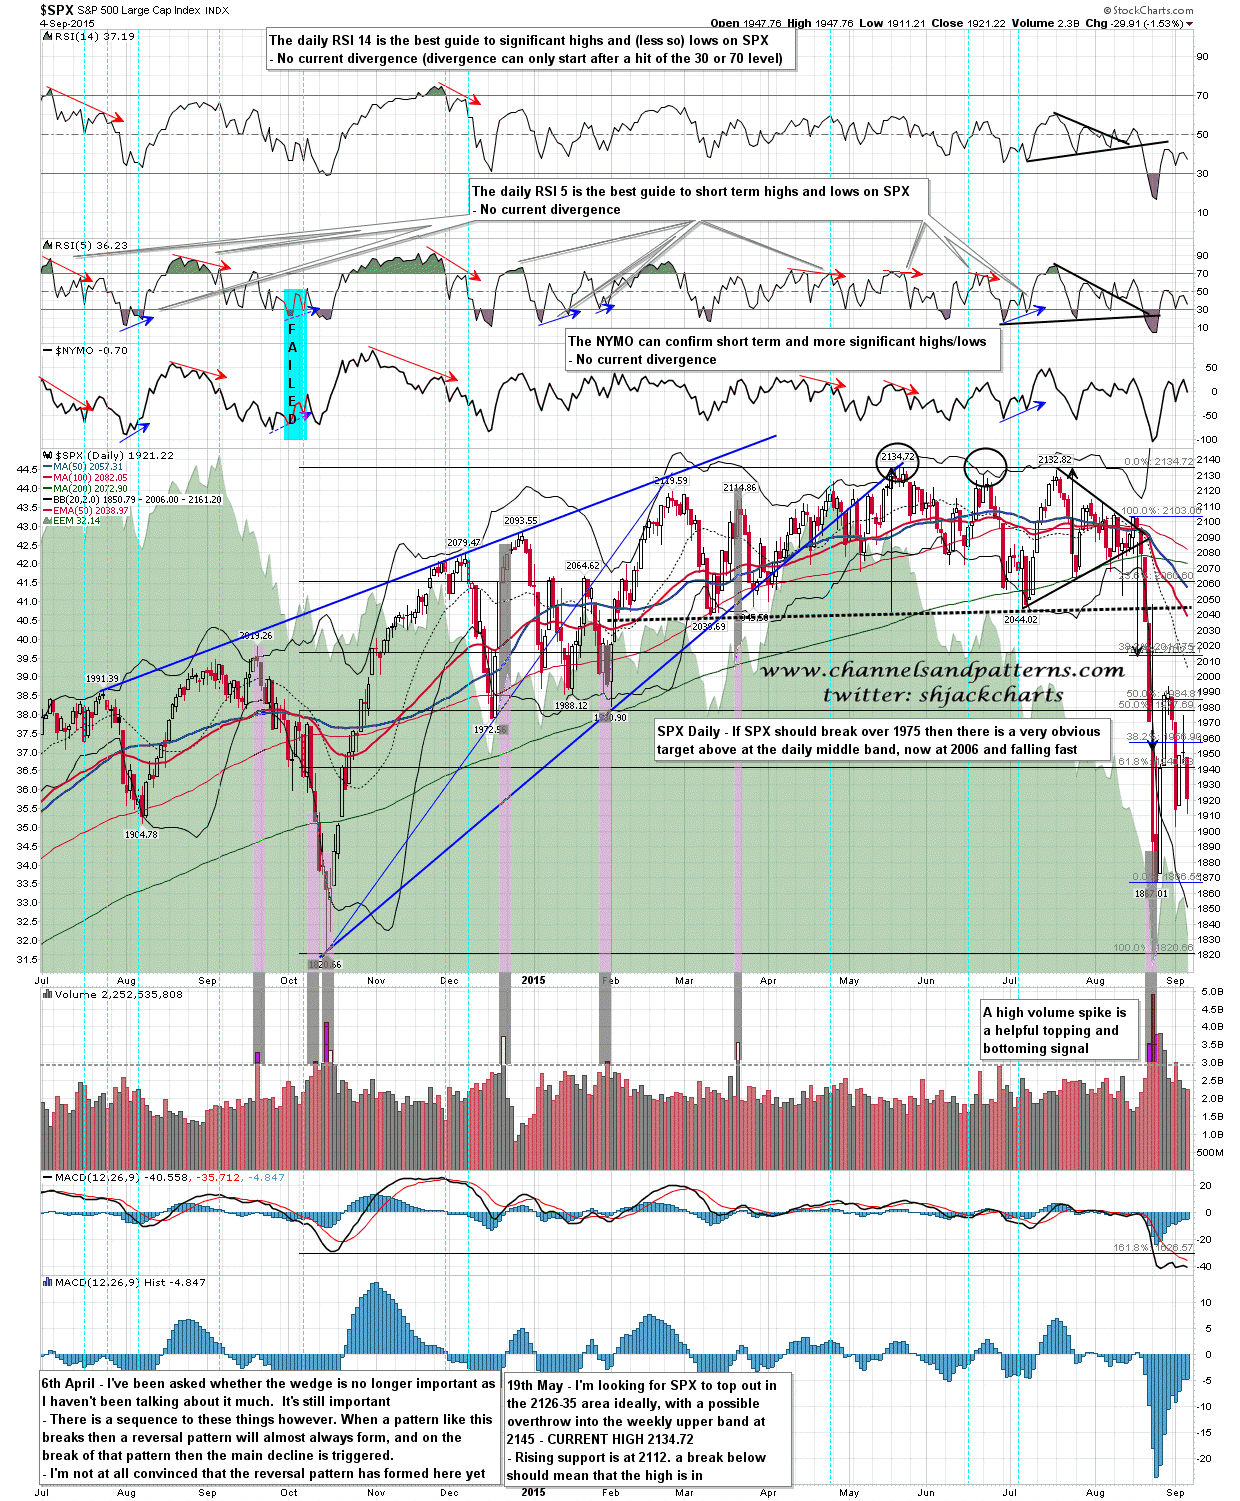
Until we see SPX break over the last high at 1975.01, I’m assuming this is a bear market rally and that this is mainly a sell opportunity.
