
Well resistance was well and truly broken yesterday, and both ES and NQ made short term higher highs after higher lows. For my money the Santa rally is on and the question now is mainly about how far that will go.
Short term I'm looking for some retracement today, though there are some very bullish patterns in play and there is a risk that ES might spike up to 1220 or higher today if they play out. On ES I have a tentative rising channel with the upper trendline hit yesterday and again at a higher level overnight. The bull pattern here is obviously the bull flag indicating to 1222+, and I wasn't happy to see that breaking up this morning. However ES has since given up those gains and the higher high was on declining RSI so I'm still thinking a retracement looks likely. NQ made a lower high overnight which was also encouraging. If ES falls back to break 1200 then I'm expecting a return to channel support in the 1188 – 90 area,which I'd be regarding as a good buying opportunity:
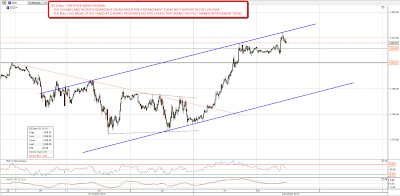
The other bull pattern that I've been looking at this morning is the IHS that has formed within the EURUSD declining channel. The neckline hasn't been broken on an hourly basis yet but if it is then the pattern indicates to declining resistance in the 1.34 area, and I'd expect to see that made, as IHSes formed at a channel trendline tend to be very good performers. If that happens we might well see ES testing the recent highs by the end of the week:

I haven't much to add to that in the short term, so I've some other interesting charts to share this morning. The first is my chart of the bull market since March 2009, which has been a move of simple technical beauty. The recent highs and lows on SPX fit very well within the established internal support / resistance internal trendlines and it would suggest a target for this December rally in the 1250 area, unless of course it breaks up through into the next range:

The next chart is the long term copper chart, where we are just under massive long term resistance. A weekly close above $405 would look very bullish but right here just under $400 this looks a very courageous long:

I've been watching the recent meltdown in bonds with interest and found a nice broadening descending wedge on the TLT 60min chart that looks very tradeable:

