
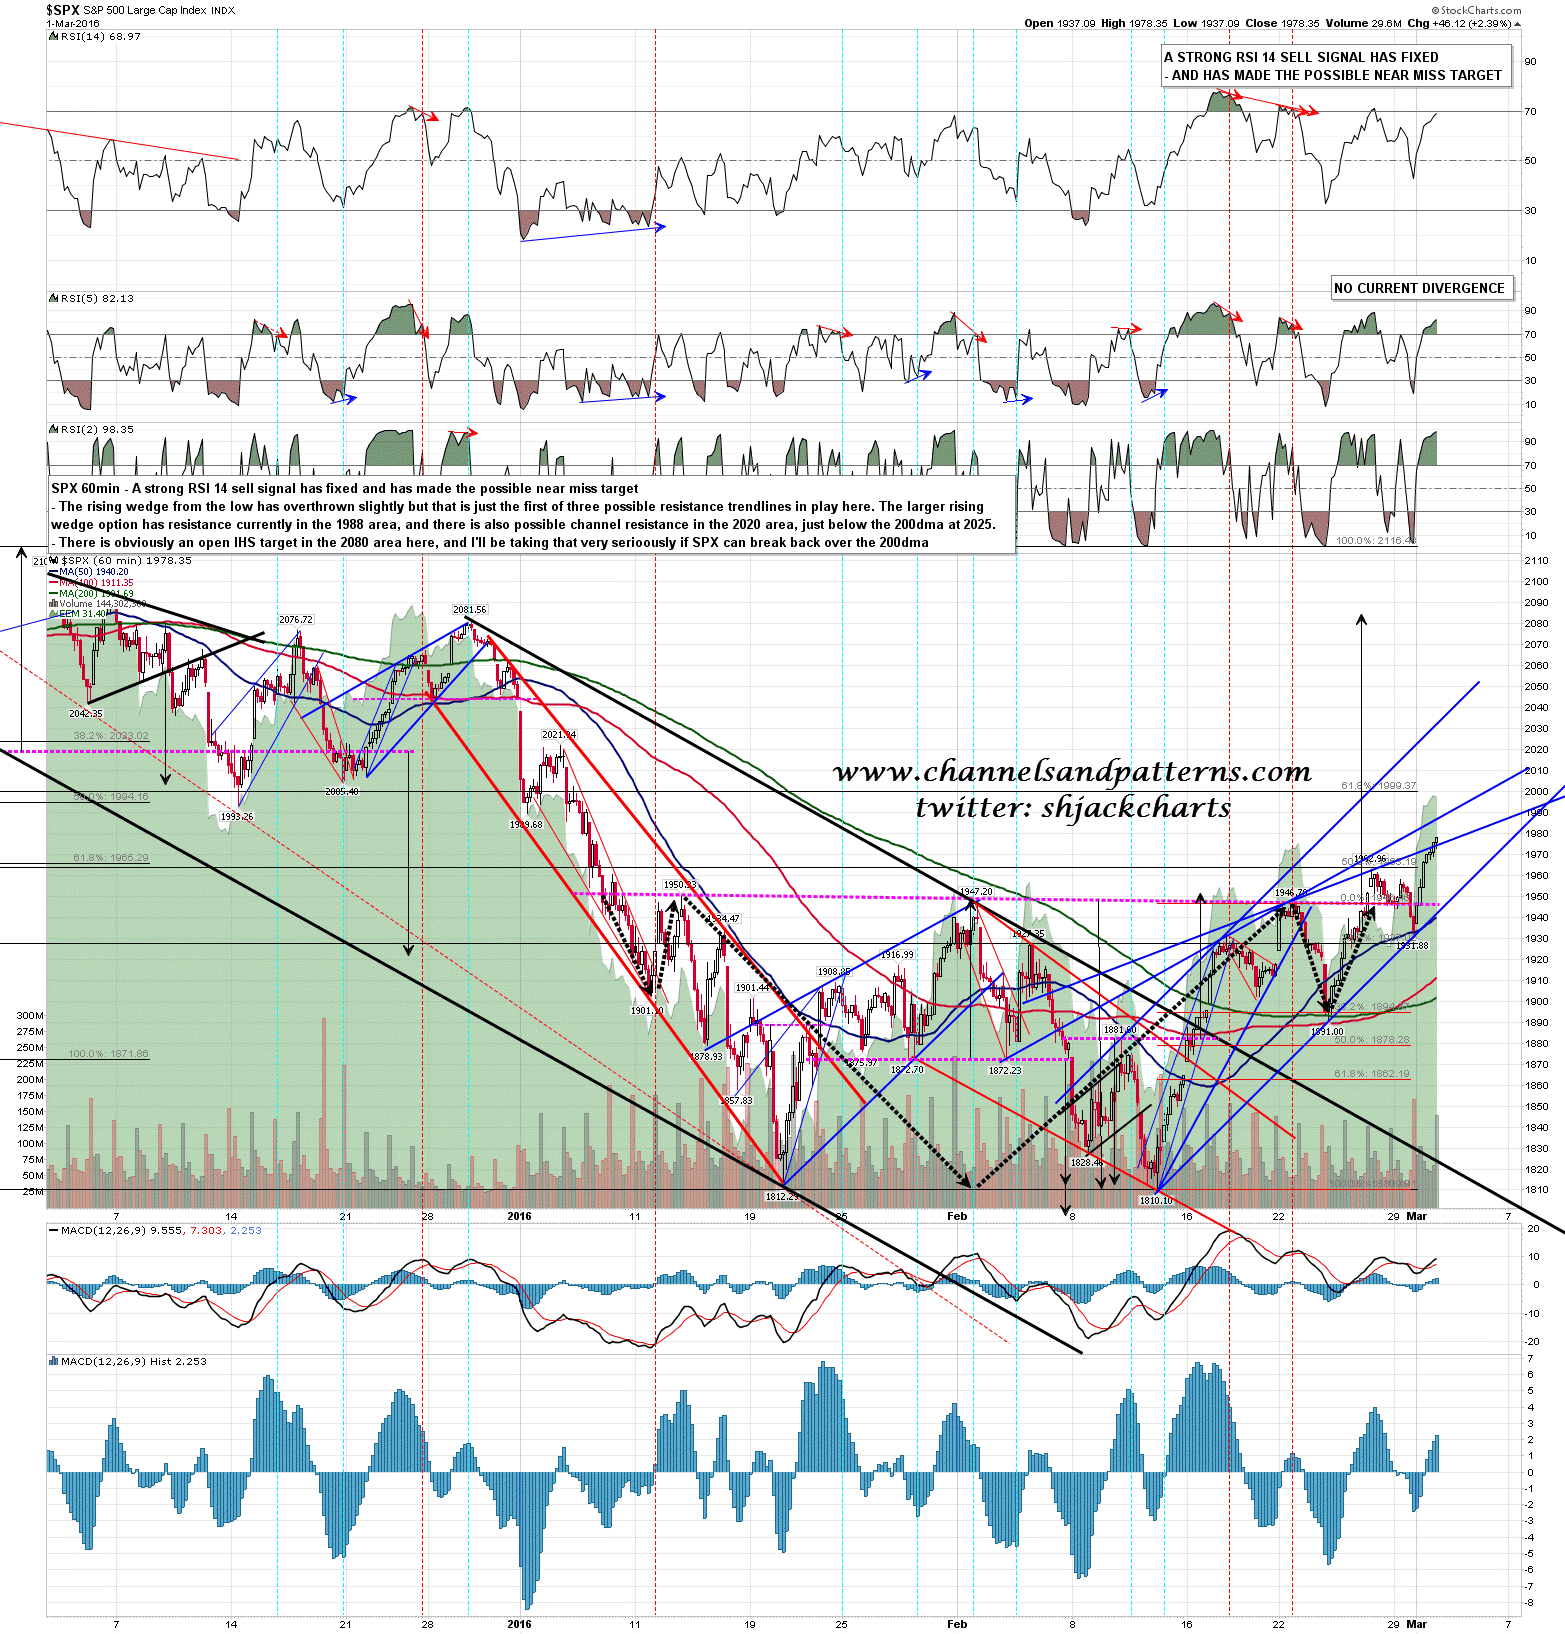
That was a very impressive trend up day yesterday and SPX closed above rising wedge resistance. That may be overthrowing bearishly here, but is only one of the three possible decent resistance trendlines in play. If SPX reverses here and breaks down through wedge support, currently in the 1942 area, then the lowest trendline is right, and the wedge would then be breaking down. Until then though the alternate wedge resistance trendline is in the 1988 area and possible channel resistance is in the 2020 area.
In terms of resistance levels I’m looking for a buyable dip this morning and then a likely move with obvious targets at the 61.8% fib retrace target and 100dma at 2000, then the very important 100 week MA at 2011, and then the also very important 200dma now at 2025. This is the key resistance zone at 2000-25 and only on a conversion of the 200dma into support does making the IHS target in the 2080 area become a strong prospect. SPX 60min chart:
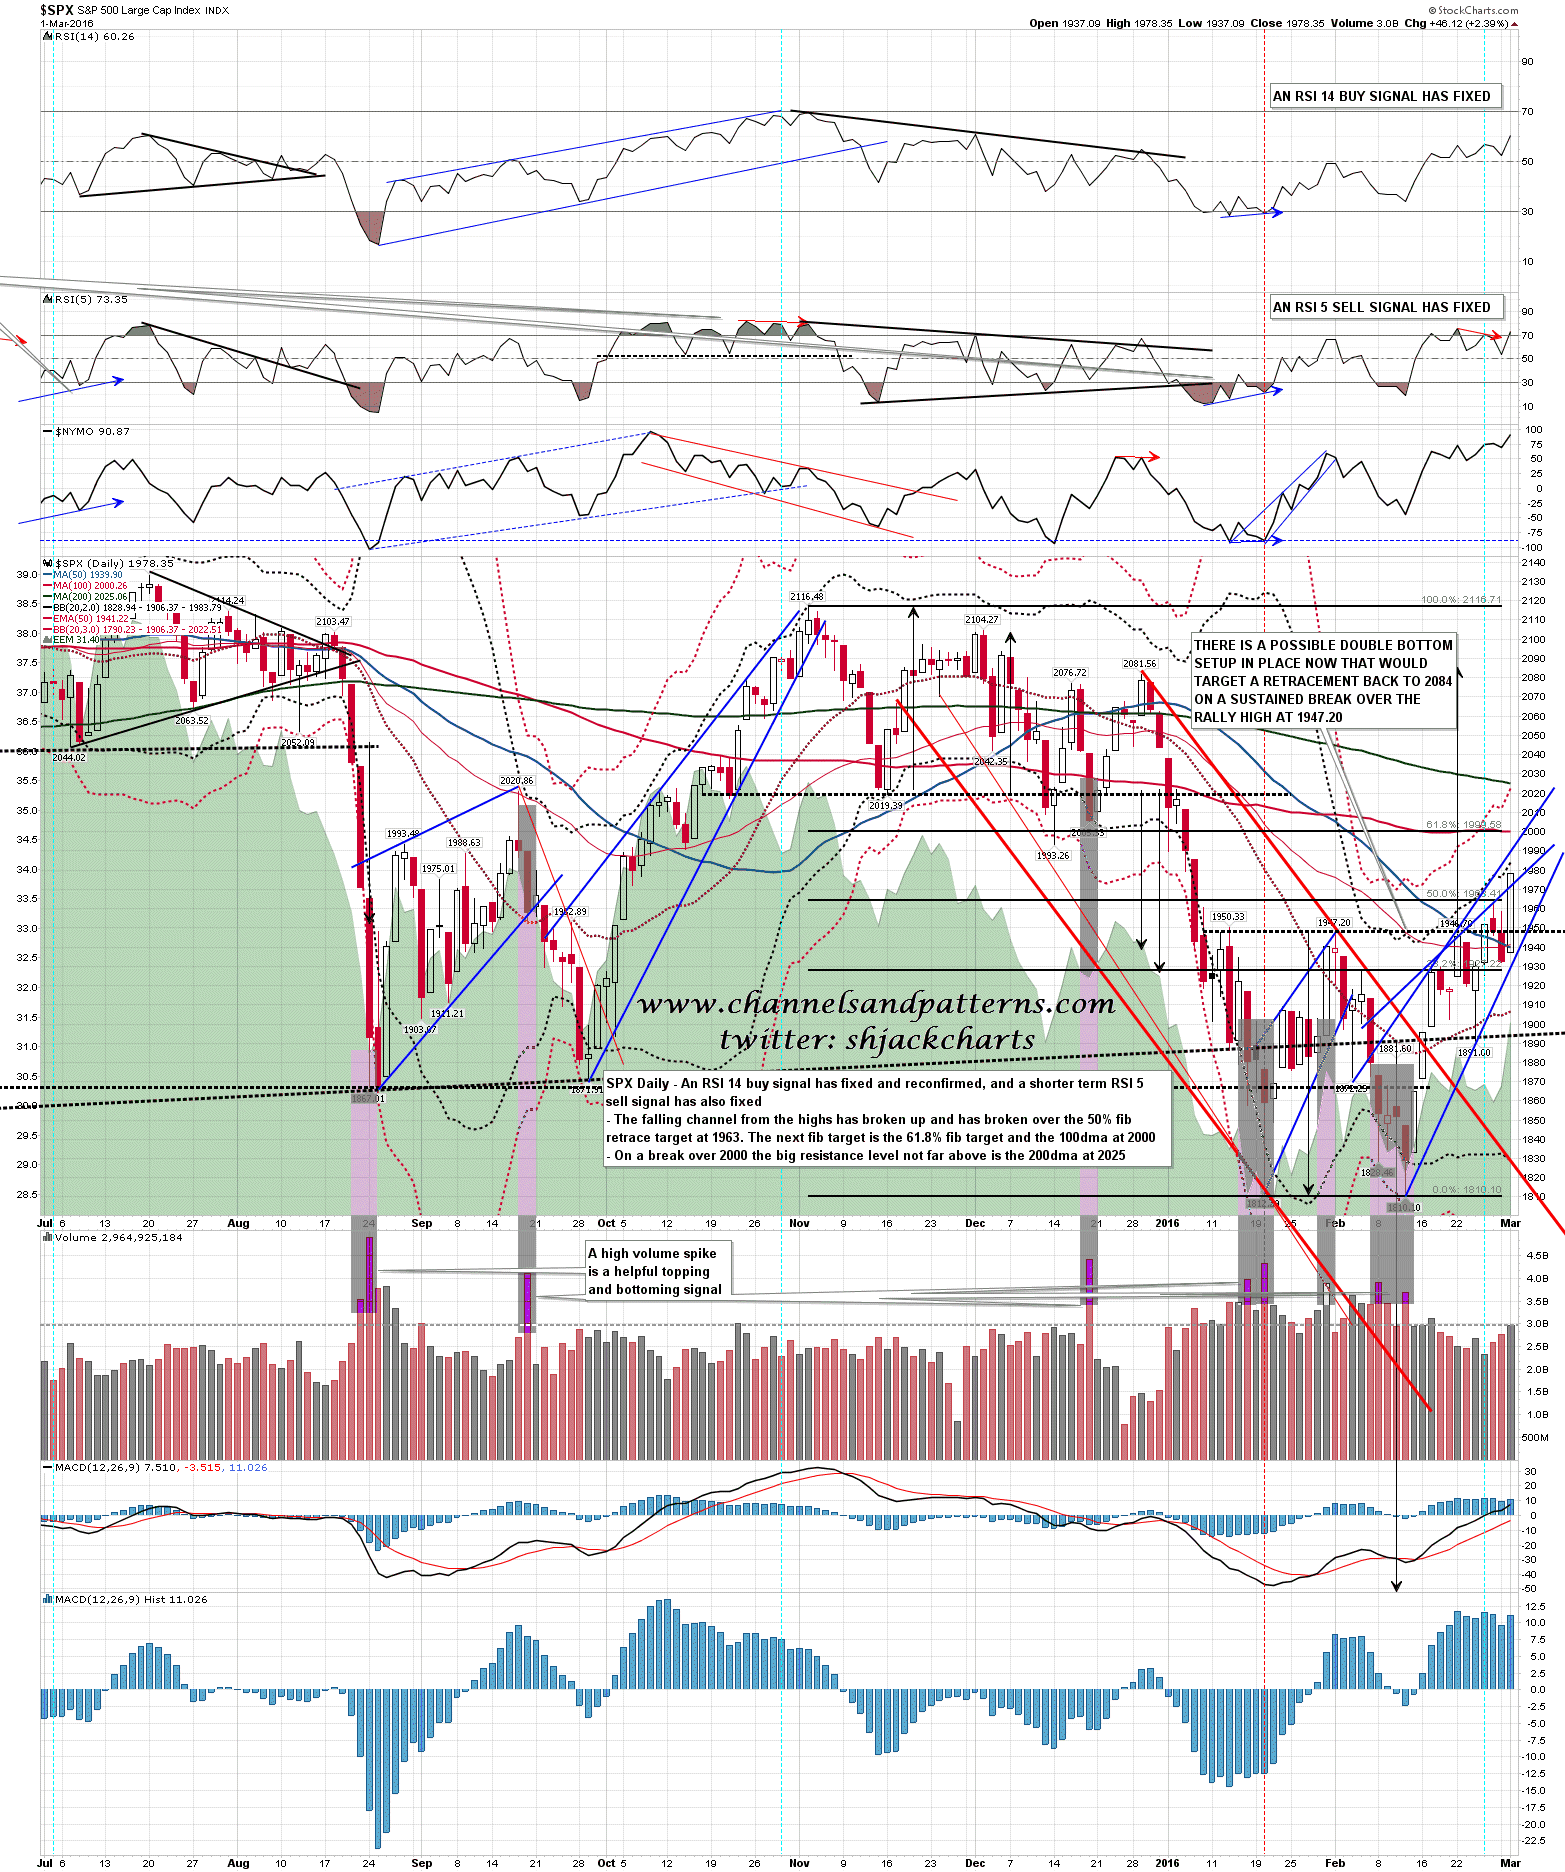
SPX daily chart:
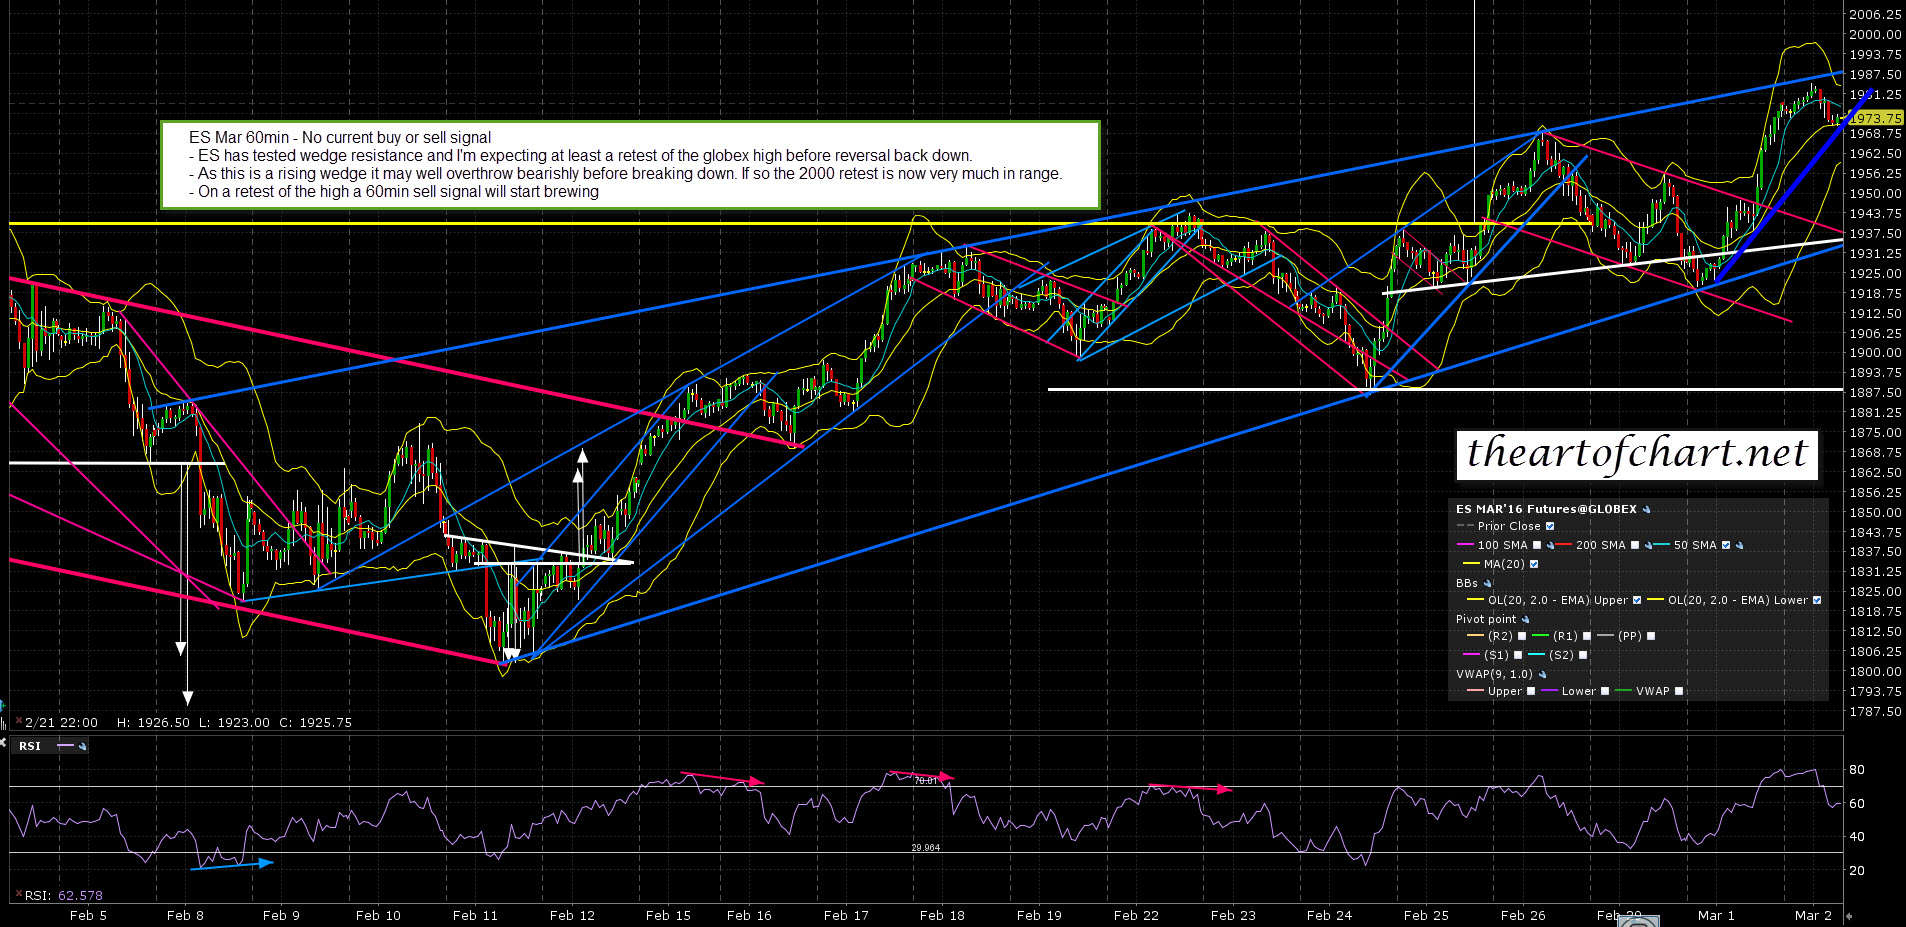
On the ES chart wedge resistance has been tested on the overnight high. If we are to turn here I’d be looking for at least a retest of the globex high at 1984.5 to set up a sell signal before reversal back down. ES 60min chart:
SPX is now close to testing the key resistance area that I’ve been looking at for several weeks. I’m looking for a reversal back down from this test but I might be mistaken of course. If bulls can convert the 200dma into support, then I am mistaken, and the IHS target in the 2080 area should then be tested.
