
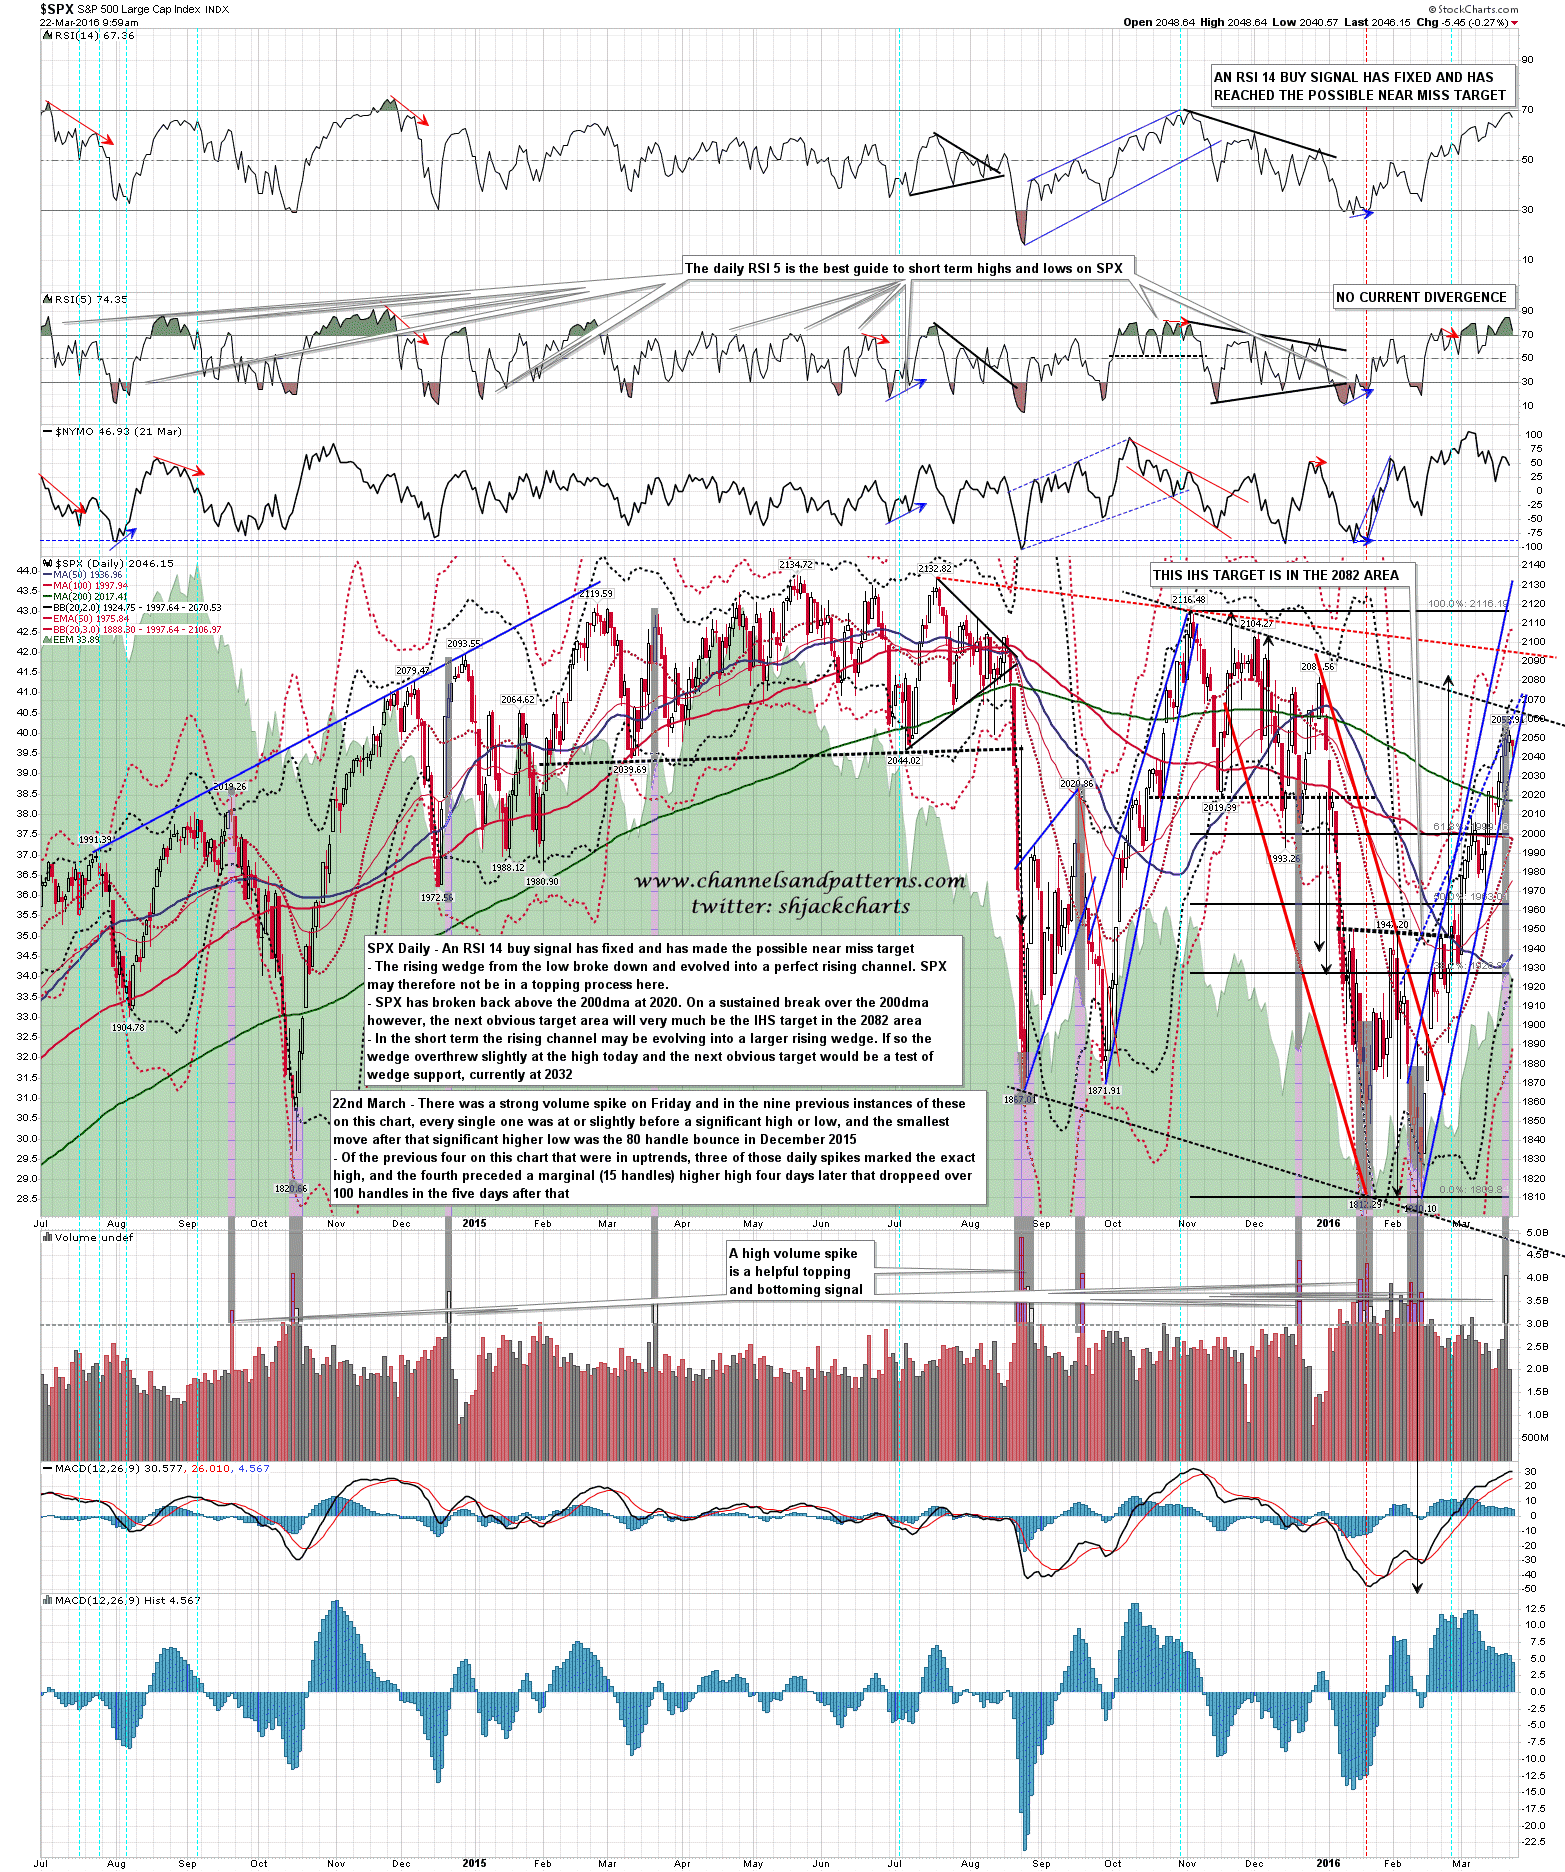
It is highly likely that SPX is close to the rally high here, or has made it already, and that at minimum SPX should now be the topping process for that rally. As well as the various patterns and divergences a 60min sell signal fixed at the open this morning, and the volume spike seen on Friday tends to be the market equivalent of the ‘black spot’ at predicting the imminent death of short term trends.
On the daily chart below there are nine previous instances of this kind of volume spike, and all of them were at or slightly before a significant high or low. The smallest move after the high or low was made on any of those nine instances was 80 handles on the bounce in December 2015.
Of the five previous examples before significant lows, four of those involved more than one volume spike before the turn, but all four previous instances before a high needed only one volume spike day. Three of those made the swing high that day and the other made a marginal new high four days later just 15 handles higher, before dropping over 100 handles in the five days after that. SPX daily chart:
I was asked yesterday afternoon whether I was sure that SPX was making a high here and this was my reply below, which I think put my view across well:
shjack_charts [03:06:09 PM]: I hear you
shjack_charts [03:06:25 PM]: I’d offer you certainty but it rode off on my unicorn
There is no such thing as certainty in market terms, though that doesn’t prevent people searching for it. There are quite a number offering it too but as far as I’m aware they’re all fools, or frauds, or both. What we have instead of certainty is an ability to consider the relative odds of particular outcomes, and the odds are very much stacked against the bulls managing to take this rally much higher from here. Could the much lower probability outcome happen anyway? Of course it could. That is the nature of relative probabilities, but it isn’t likely.
SPX rising wedge support is now at 2032 and I’m expecting to see that level tested and very possibly broken today or tomorrow. We’ll see how that goes.
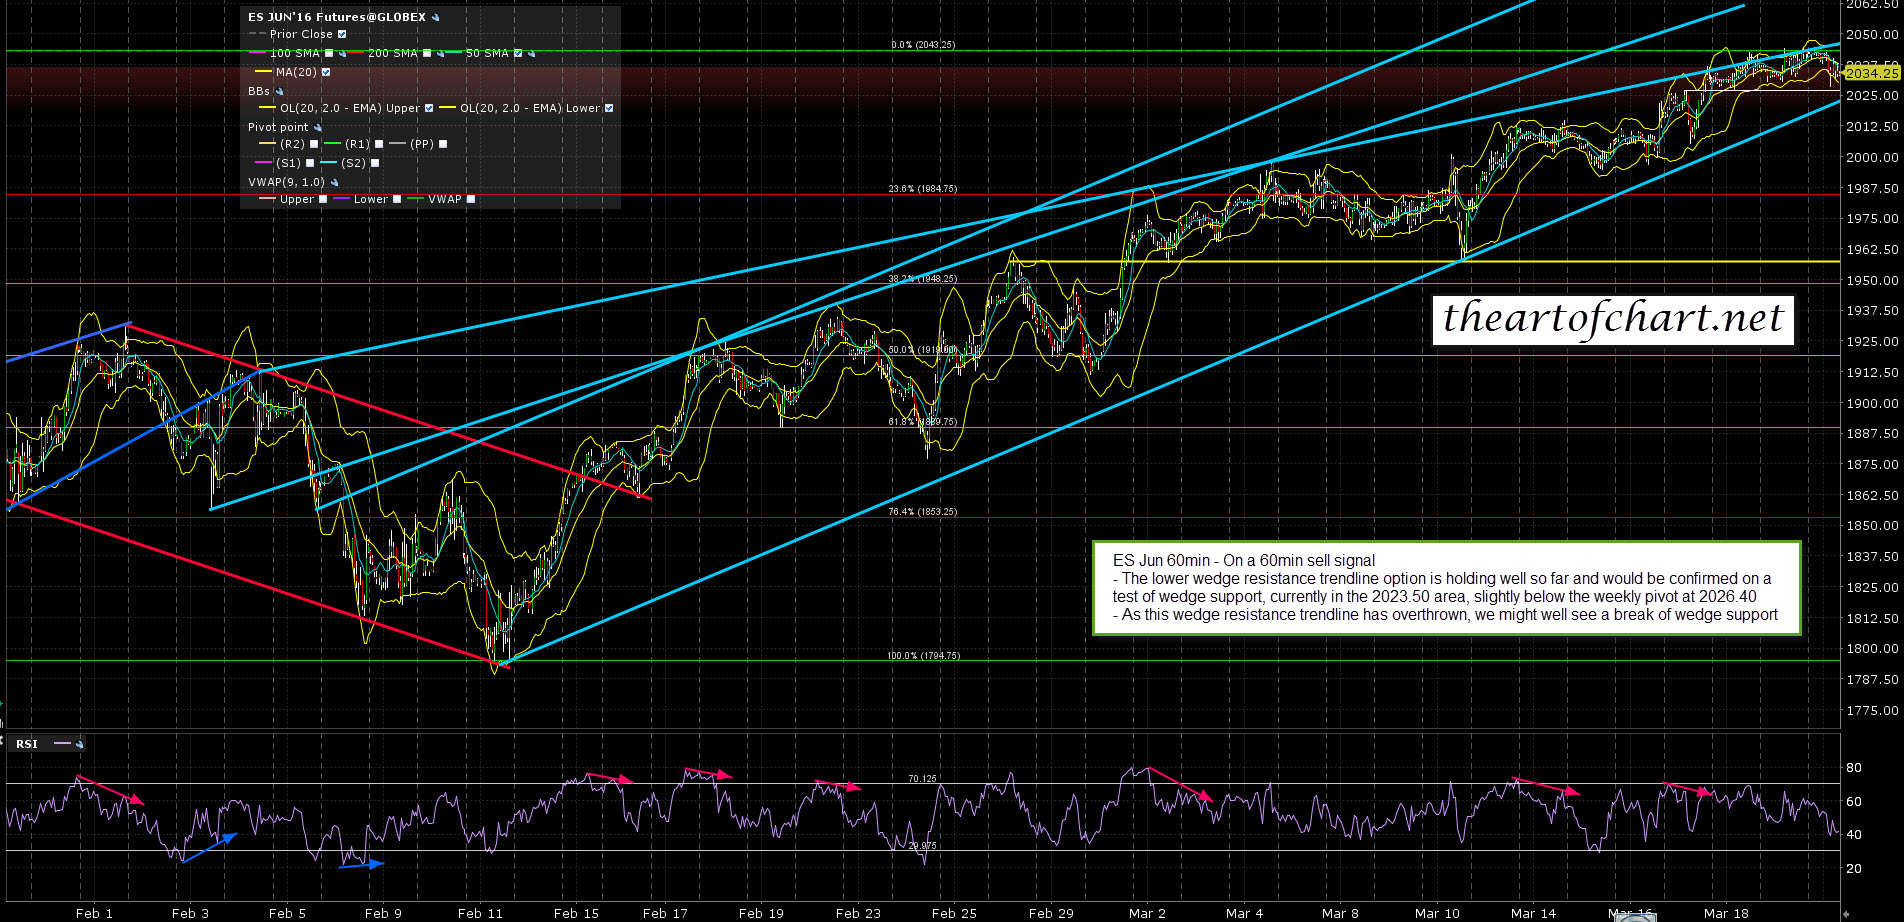
ES rising wedge support is currently in the 2024 area and the ES weekly pivot is slightly above at 2026.40 (2035 SPX area). I’m watching those levels with great interest today. ES Jun 60min chart:
On thing I’m not seeing yet is the reversal pattern that should form before the large decline that should be coming our way soon. I think we’ll be forming that this week and we may yet see a higher high made as part of that process. I’m looking for an AM high and strong fail from there today.
An announcement for this week. On Thursday after the close Stan and I are doing a free public webinar on ‘Trader Psychology – Pitfalls and Remedies’ with Mike Vacchi of www.princetontrader.com. That should be interesting and entertaining as well as educational and all are welcome. If you are one of the many under the impression that there is any such thing as certainty in trading then I would strongly recommend that you attend, though we’ll be talking about several other trading delusions and trader psychology fails in the webinar as well. You can sign up for the webinar at the bottom of this page here.
